Models of the upper transition region of sunspots have been derived based on the observed radio spectrum between 3 and 18 GHz from Radio Astronomical Telescope of the Academy of Sciences 600 (RATAN-600) observations. Our objective is to match the spectrum to show that, within the limits of the one-dimensional observations and modeling, we have obtained a reasonable description of the upper transition-region structure of sunspots. We have developed a diagnostic method, described below.
Method and results
Among all quasi-stationary solar structures the atmosphere over sunspots is characterized by the most extreme values of the temperature gradients and magnetic fields. Use of the radio band eliminates such difficulties as the solution of non-LTE transfer equations and inaccurate ion abundances. The system can be considered in thermal equilibrium because the measurements are in the Rayleigh–Jeans regime. This means that measured brightness temperatures of the microwave emission in the optically thick atmosphere actually represent the thermal electron temperatures. At centimeter wavelengths, the main contribution to the sunspot emission is a gyroresonance (GR) mechanism. Bright, optically thick GR radiation is mainly generated at the second and third harmonics of the gyrofrequency of ordinary and extraordinary modes.
A recent upgrade of RATAN-600 radio telescope (Bogod et. al., 2011) has improved technical capabilities of the exploration of the upper transition region and lower corona. A detailed spectral analysis with 1% frequency resolution covers the working range from 3 to 18 GHz with high-precision polarization measurements and a moderate one-dimensional spatial resolution (18 arcsec at 15 GHz).
Previously (Kaltman et. al., 2013) the condition of compliance between modeled parameters and observed features was performed by a trial and error approach. In the present paper we have implemented an automatic iterative diagnostic method, using the observational data of RATAN-600 at numerous (up to 60) frequencies. The method of estimation of solar atmospheric parameters (electron temperature and, more roughly, electron density) above sunspots based on the observation of polarized radio emission on RATAN-600 and on the full vector of the photospheric magnetic field is developed. As the first step we reconstructed the magnetic field of the studied active regions. To estimate temperature – height profile T(H) we suggest an iterative fitting method, based on calculation of the GR radio emission in the 3 – 18 GHz range (starting from some initial height profiles), convolution of the radio maps with the telescope beam and correction of height profiles using comparison with maximum of the observed intensity scan. Electron density N(H) was taken from the condition NT = const, which is well fulfilled in the height range of observing GR emission. The const value was chosen to provide best quality of fitting. For implementation of this method an effective code for radio emission calculations was developed.
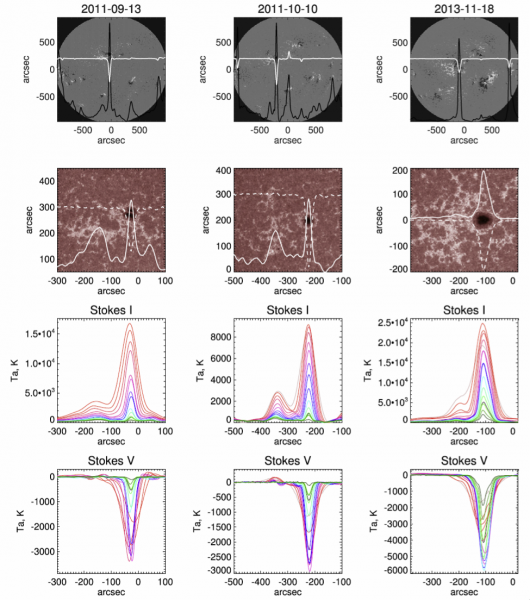
Figure 1. Observations of ARs NOAA 11289, 11312, and 11899. First row: RATAN-600 scans of intensity and polarization flux (Stokes parameters I and V) at 10 GHz are superimposed on full-disk HMI magnetograms. Second row: areas with active regions are shown in the larger scale in line 1700 Å (AIA) superimposed by scans at 15 GHz (RATAN-600). In full microwave intensity, a free – free brightening above faculae (clearly visible in the line 1700 Å) is noticeable on the side of the core (sunspot) sources, but in the polarized emission only sources above the spots are registered. Two bottom rows show the RATAN-600 scans of Stokes parameters I and V (in terms of antenna temperature) in the range from 3 to 18 GHz.
An advantage of diagnostic modeling is the ability to treat particular regions of the solar atmosphere, such as sunspots and active regions, without assuming a particular heating mechanism, and to treat a larger number of microwave emission frequencies. Characterization of the height distribution of the kinetic temperature of a sunspot-associated source is done through a link between the emission at a certain wavelength and an appropriate level of GR microwave radiation. The developed method is tested using three active regions (Figure 1) where the main component is a unipolar GR source with a high degree of polarization. In Figure 2 the result of fitting for one of the AR is shown. We obtained reasonable temperature behavior in the transition region and lower corona and found that the upper boundary of the transition region is located at 2 – 2.3 Mm, the temperature of the low corona is about 1.5 – 2.5 MK, and the estimated electron density is 1 – 5 × 109 cm−3 (Figure 3).
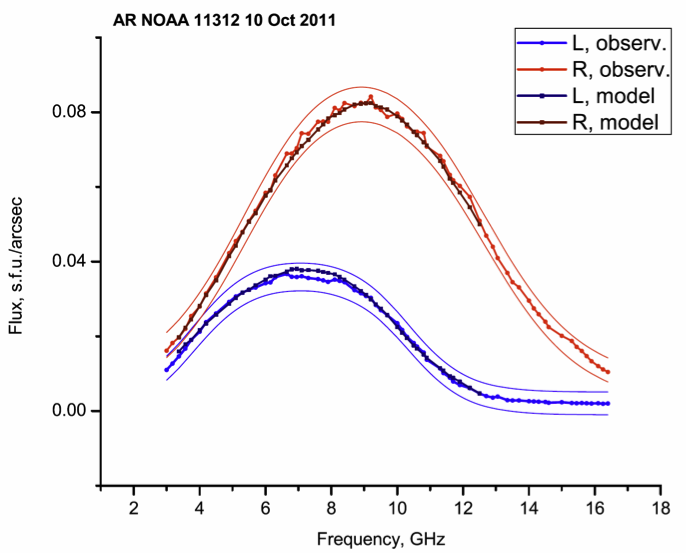 Figure 2. Comparison of observed and modeled flux of AR NOAA 11899, NT = 8 × 10¹⁵ × K cm−3. Red (R) and blue (L) thin lines show estimations of the observation errors.
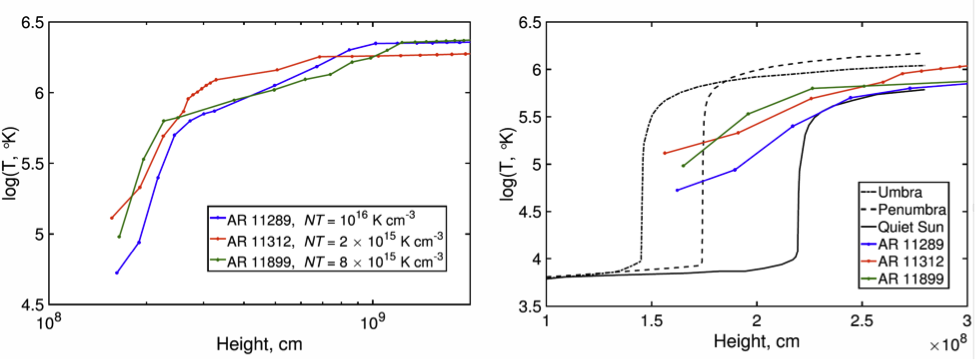 Figure 3. Temperature profiles of the modeled ARs. The left plot shows full profiles obtained by modeling. The right plot shows the part around the transition region. For comparison, the profiles calculated by Fontenla et al. (1999) are shown with black lines.
Conclusions
The parameters of Solar atmosphere in the upper transition region and lower corona (the transition region height 2 – 2.3 Mm, the temperature of the low corona 1.5 – 2.5 MK, and the electron density 1 – 5 × 109 cm−3) are in the good agreement with widely used model, such as Fontenla et al. (1999) or Mok et al. (2005). The estimated width of the transition region is found to be greater than expected from these models. We suppose that it is the effect of atmospheric inhomogeneity (a transition region placed lower above the sunspot umbra and higher above the penumbra, which leads to the spatial blurring along the height). To solve this problem, the method can be adapted for 2D radio maps.
Additional info
Based on the recent paper: A. G. Stupishin et al, 2018, Solar Phys., 293, 13. https://doi.org/10.1007/s11207-017-1228-7
References
Bogod, V.M. et. al., 2011, Astrophys. Bull. 66, 205.
Fontenla, J.M. et. al., 1999, Astrophys. J. 518, 480.
Kaltman, T.I. et. al., 2013, Geomagn. Aeron. 53, 1030.
Mok, Y. et. al., 2005, Astrophys. J. 621, 1098.
*Full list of authors: A.G. Stupishin, T.I. Kaltman, V.M. Bogod, and L.V. Yasnov