The purpose of this work is to model the emission of 17 GHz polar bright patches, which are frequently observed by the Nobeyama Radioheliograph (NoRH) in association with coronal holes. Although these bright regions have been observed for a few decades, their nature remains unclear. Our simulations were based on the temperature and density profiles from the SSC atmospheric model (Selhorst et al., 2005), with modifications to include a coronal hole atmospheric model and magnetic loops as the sources of the radio bright patches.
We calculated the radio emission at 17 GHz from coronal holes, in comparison with typical quiet Sun regions. As expected, in a static atmosphere, the lower temperature and density atmosphere inside a coronal hole resulted in lower brightness temperature values. Our results show, however, that the presence of spicules (spatially unresolved by NoRH) can produce brighter regions than what would be expected from coronal holes. To simulate the bright patches, we introduced small magnetic loops, with hotter and denser plasma than its surroundings – see Figure 1. We find that the radio emission from smaller loops (5.0 Mm of radius) comes from the top of the loop, while the emission from larger loops (7.5 Mm of radius) originates from their footpoints. As a consequence, the size of the simulated bright patches originating from small loops is larger than from larger loops, ∼11’’ and ∼8’’, respectively. However, after convolving the results with the NoRH beam (~10’’), large loops produced larger and colder bright patches in comparison with the results obtained for the small loops.
 Figure 1: The SSC atmospheric model with the presence of spicules and three small magnetic loops located in the spicules-less region. The arrows indicate the direction of the radiative transfer integration at the polar region.
The inclusion of magnetic loops in the model only affect the radio brightness at 17 GHz if their temperature and density are substantially different from the surrounding plasma at heights where τ ≈ 1. This happens near the upper chromosphere and lower corona. These results are in agreement with the findings of Brajša et al. (2007). Moreover, loop models which had higher density and temperature only at coronal heights do not contribute significantly to the radio emission at 17 GHz. Such loops could be brighter at EUV wavelengths, and thus this could explain the absence of a one-to-one correlation between the 17 GHz bright patches and those observed in EUV (Nindos et al., 1999; Nitta et al., 2014).
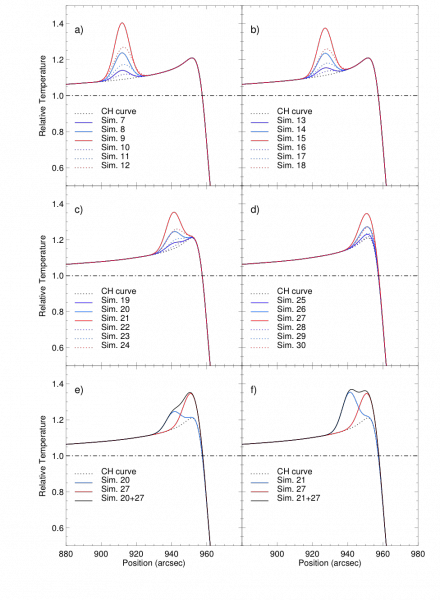
The maximum increase in brightness temperature TBmax in the simulations reached up to 30% by placing the loops at higher latitudes. However, the emitting area of these bright regions was small (~1’’), much smaller than the NoRH beam. As a consequence, after the beam convolution, the size of the bright patch corresponds to the beam size (as expected), in agreement with the minimum size of the bright patches observed in the NoRH maps (Nindos et al., 1999).
On the other hand, a single small loop located near the pole is not able to reproduce the larger bright patches sizes observed (50’’− 55’’, Nindos et al. 1999). Such larger emitting areas could be caused by the presence of a large number of small magnetic loops unresolved by the NoRH beam. As showed in Figure 2e and 2f, even loops separated by an angular distance of 3o (∼37 Mm) will not be resolved in the NoRH maps. Moreover, the presence of small magnetic loops close to the limb can result in a merged brightness limb profile, increasing the observed limb brightening and its width.
To improve our knowledge about these small bright structures inside the coronal holes high resolution observations at different wavelengths are necessary. Today, only solar observations with ALMA can achieve the required spatial resolutions (Wedemeyer et al., 2016).
 Figure 2: Simulations of bright patches located at a) 71.1$^{\circ}$, b) 74.1$^{\circ}$, c) 77.4$^{\circ}$ and d) 81.4$^{\circ}$. Different colors were used to refer to the distinct simulations listed in Table 1 in Selhorst et al. (2017). In panels e) and f) two bright patches were simulated at different longitudes, respectively, 77.4$^{\circ}$ and 81.4$^{\circ}$.
Based on the recent paper: Selhorst et al.: Association of radio polar cap brightening with bright patches and coronal holes, The Astrophysical Journal, 851, article id. 146 (2017) DOI: 10.3847/1538-4357/aa992b
References
Brajša, R., Benz, A. O., Temmer, M., et al. 2007, Solar Physics, 245, 167
Selhorst, C. L., Silva, A. V. R., & Costa, J. E. R. 2005, Astronomy & Astrophysics, 433, 365
Nindos, A., Kundu, M. R., White, S. M., et al. 1999, The Astrophysical Journal, 527, 415
Nitta, N. V., Sun, X., Hoeksema, J. T., & DeRosa, M. L. 2014, The Astrophysical Journal, 780, L23
Wedemeyer, S., Bastian, T., Brajša, R., et al. 2016, Space Science Reviews, 200, 1
*Full list of authors: Caius L. Selhorst, Paulo J. A. Simões, Alexandre J. Oliveira e Silva, G. Giménez de Castro, Joaquim E. R. Costa, and Adriana Valio
