The study of time-dependent solar active region morphology and its relation to eruptive events requires analysis of imaging data obtained in multiple wavelength domains with differing spatial and time resolutions, ideally in combination with 3D physical models. To facilitate this goal, we have undertaken a major enhancement of our IDL-based simulation tool, GX Simulator, originally developed for modeling microwave and X-ray emission from flaring loops (Nita et al. 2015), to allow it to simulate quiescent emission from solar active regions.
GX Simulator is publicly available as part of the SolarSoftWare (SSW) IDL repository. The object-based architecture of GX Simulator, which runs on Windows, Mac and Linux platforms, provides an interactive graphical user interface that allows the user to import photospheric magnetic field maps as input to the magnetic field extrapolations within the tool, or alternatively to import 3D numerical magnetic field models. The magnetic skeleton may be populated with thermal plasma by importing 3D density and temperature distribution models or, alternatively, by assigning to each individual volume element numerically defined differential emission measure (DEM) distributions inferred from parametric heating EBTEL models (Klimchuk et al. 2008) that assume either steady-state or impulsive nanoflare plasma heating.
The application integrates shared-object libraries containing fast microwave (gyrosynchrotron and gyroresonance) emission codes developed in FORTRAN and C++ (Fleishman and Kuznetsov 2010), and soft and hard X-ray and EUV codes developed in IDL.
A major functionality added to the current release of the GX Simulator distribution package is an almost fully automated way of downloading needed SDO maps and the ability to produce NLFFF reconstructions using the weighted optimization code described and tested by Fleishman et al. (2017).
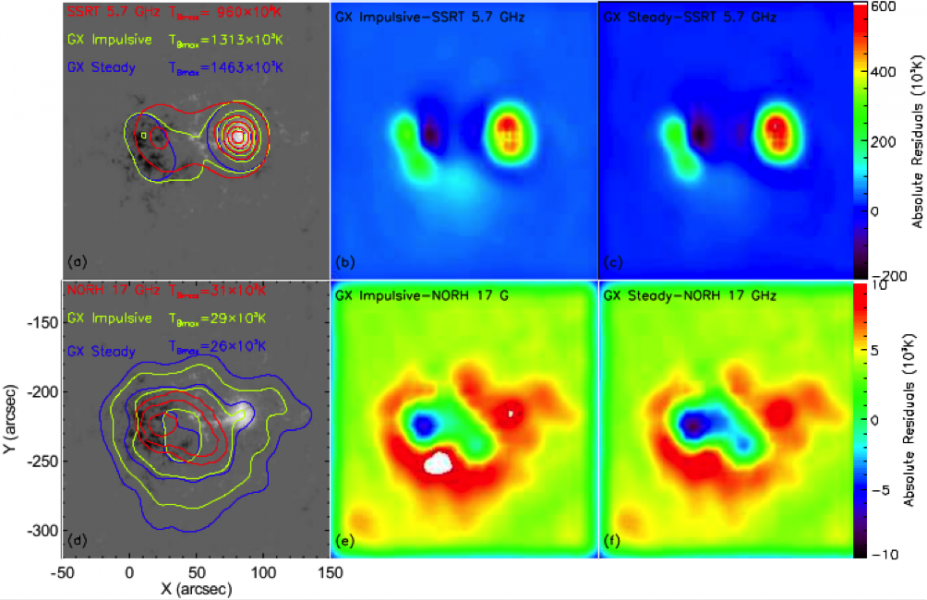
We illustrate our upgraded tool by creating synthetic emission maps for the AR 11072 obtained on 23-May-2010 12:00:00 UT by SDO/AIA, Nobeyama Radio Heliograph (NORH), and the Siberian Solar Radio Telescope (SSRT), as shown in Figure 1 in the case of the 94 Angstrom AIA channel, and in Figure 2 for the radio emission.

Figure 1 Example of EUV synthesized images to observed data comparison for AR 11072 on 23-May-2010. Left Column: SDO/AIA 94 A image averaged for a six hour interval centered on the time of the NLFFF magnetic field model. Second column: Synthesized EUV images using the EBTEL impulsive heating DEM solution. Third column: Synthesized EUV 94 A image using the EBTEL steady-state heating DEM solution. Both impulsive and steady-state heating models were obtained using the same volumetric heating rate. The images are convolved with circular a Gaussian beam with $\sigma_x=\sigma_y=1.2”$. Forth column: Impulsive heating model to data relative residuals clipped to the $\pm100\%$ range. Right column: Steady-state heating model to data relative residuals clipped to the $\pm100\%$ range.

Figure 2 AR 11072 23-May-2010 12:00:00 UT: comparison between microwave synthesized images and observations by SSRT at 5.7 GHz (top row) and NORH at 17~GHz (bottom row). a) 10%, 20%,50%,70% and 90% contours of the observed SSRT 5.7 GHz brightness temperature (red contours), impulsive heating (green contours) and steady-state heating (blue contours) synthesized brightness temperature, overlaid on top of the SDO/HMI LOS magnetogram. The plot inset displays the peak brightness temperatures corresponding to the three 5.7 GHz brightness temperature maps, $960\times10^3$K, $1313\times10^3$K and $1463\times10^3$K, respectively. b) Impulsive heating synthetic emission to SSRT 5.7 GHz temperature residual map. c) Steady-state heating synthetic emission to SSRT 5.7 GHz temperature residual map. The same scale in the residual maps shown in panels (b) and (c) is adopted for ease of comparison. d) 55%,70% and 90% contours of the observed NORH 17 GHz brightness temperature (red contours), impulsive heating (green contours) and steady-state heating (blue contours) synthesized brightness temperature, overlaid on top of the SDO/HMI LOS magnetogram. The plot inset displays the peak brightness temperatures corresponding to three 17 GHz brightness temperature maps, $31\times10^3$K, $29\times10^3$K and $26\times10^3$K, respectively. e) Impulsive heating synthetic emission to NORH 17 GHz temperature residual map. f) Steady-state heating synthetic emission to NORH 17 GHz temperature residual map. The same scale in the residual maps shown in panels (e) and (f) is adopted for ease of comparison.
Figure 2 demonstrates that our approach resulted in a model that is quantitatively consistent with the radio imaging data produced by SSRT at 5.7 GHz (top row) and NORH at 17 GHz (bottom row). In the first column of Figure 2 we display the observed microwave brightness temperature maps (red contours) and the synthesized radio contours, for both steady-state and impulsive models, on top of the HMI LOS magnetic field maps. Remarkably, for both observed frequencies, the peaks of the brightness temperature maps are reproduced within a few tens of percent accuracy by both heating models. The location and morphology of the 5.7 GHz SSRT contours are also matched remarkably well in the simulations. However, the NORH 17 GHz contours indicate a more compact source than in the simulations, as well as a ∼ 20′′ spatial displacement of the emission peak.
Based on data to model comparison in both EUV and microwave domains, we conclude that, although still perfectible, the magneto-thermal structure that we modelled using the recent upgrade of the GX Simulator may be considered a reasonably good approximation of the reality.
Additional info
Based on the recent paper: Gelu M. Nita et al. “Dressing the Coronal Magnetic Extrapolations of Active Regions with a Parameterized Thermal Structure.” ApJ 853.1 (2018)
References
Klimchuk, J. A., Patsourakos, S., & Cargill, P. J. 2008, ApJ, 682, 1351
Fleishman, G. D., & Kuznetsov, A. A. 2010, ApJ, 721, 1127
Fleishman, G. D., Anfinogentov, S., Loukitcheva, M., Mysh’yakov, I., Stupishin, A. 2017, ApJ, 839, 30
Fontenla, J. M., Curdt, W., Haberreiter, M., Harder, J., & Tian, H. 2009, ApJ, 707, 482
Nita, G. M., Fleishman, G. D., Kuznetsov, A. A., Kontar, E. P., & Gary, D. E. 2015, ApJ, 799, 236
