Occasionally the Sun ejects a pair of magnetized plasma clouds, called coronal mass ejections (CMEs), roughly into the same propagation direction in closely timed sequence. If the second CME is faster than the first one, the CMEs could either just slip through each other or they could collide and interact, when the following CME catches up the preceding one. The possibility of the CME-CME interaction was first suggested by Gopalswamy et al. (2001). They noticed that when a faster CME appeared to overtake a slower CME in a white-light image of the solar corona taken on 2000 June 10, a radio receiver on board the Wind spacecraft observed a simultaneous enhancement of radio emission around the frequency of 2 MHz. They interpreted this radio emission to be a local enhancement of the type II radio burst, which is caused by electrons accelerated in the shock front driven by the CME. If a shock propagates into a region of denser material, for example a preceding CME, it becomes a stronger and more efficient accelerator of electrons. Therefore, the fact that the type II radio emission intensified exactly at the time when the CMEs appeared to overlap in the image, serves as independent evidence that the two CMEs were indeed colliding and interacting, instead of just slipping through each other.
Type II radio enhancement during the CME-CME interaction on 2013 May 22
We investigate the spatial location of the source region of a type II emission enhancement observed during a CME–CME interaction event on 2013 May 22. Figure 1 shows that when the following CME (the brightest feature near the center of Fig. 1a by the LASCO/C3 coronagraph on board the SOHO spacecraft) catches up and overlaps the preceding CME (dimmer feature ahead of the following CME), all three radio receivers on board Wind (Wind/WAVES) and STEREO-Ahead (SWAVES-A) and Behind (SWAVES-B) spacecraft detected a simultaneous enhancement of type II emission at decameter-hectometric (DH) wavelengths (the bright feature between the white vertical lines around and below 1 MHz in Figs 1(c-e). We utilize a direction finding (DF) technique to estimate the arrival direction of the oncoming radio emission as seen from the observing spacecraft in order to find a further verification that the enhancement of type II emission originates from the CME–CME interaction region. We compare the obtained radio source direction with CME observations by over-plotting the corresponding sky-plane location of the radio source on the white-light images of the CMEs. In order to find the spatial location of the radio source one needs to use triangulation of source directions from two spacecraft with different viewpoints.
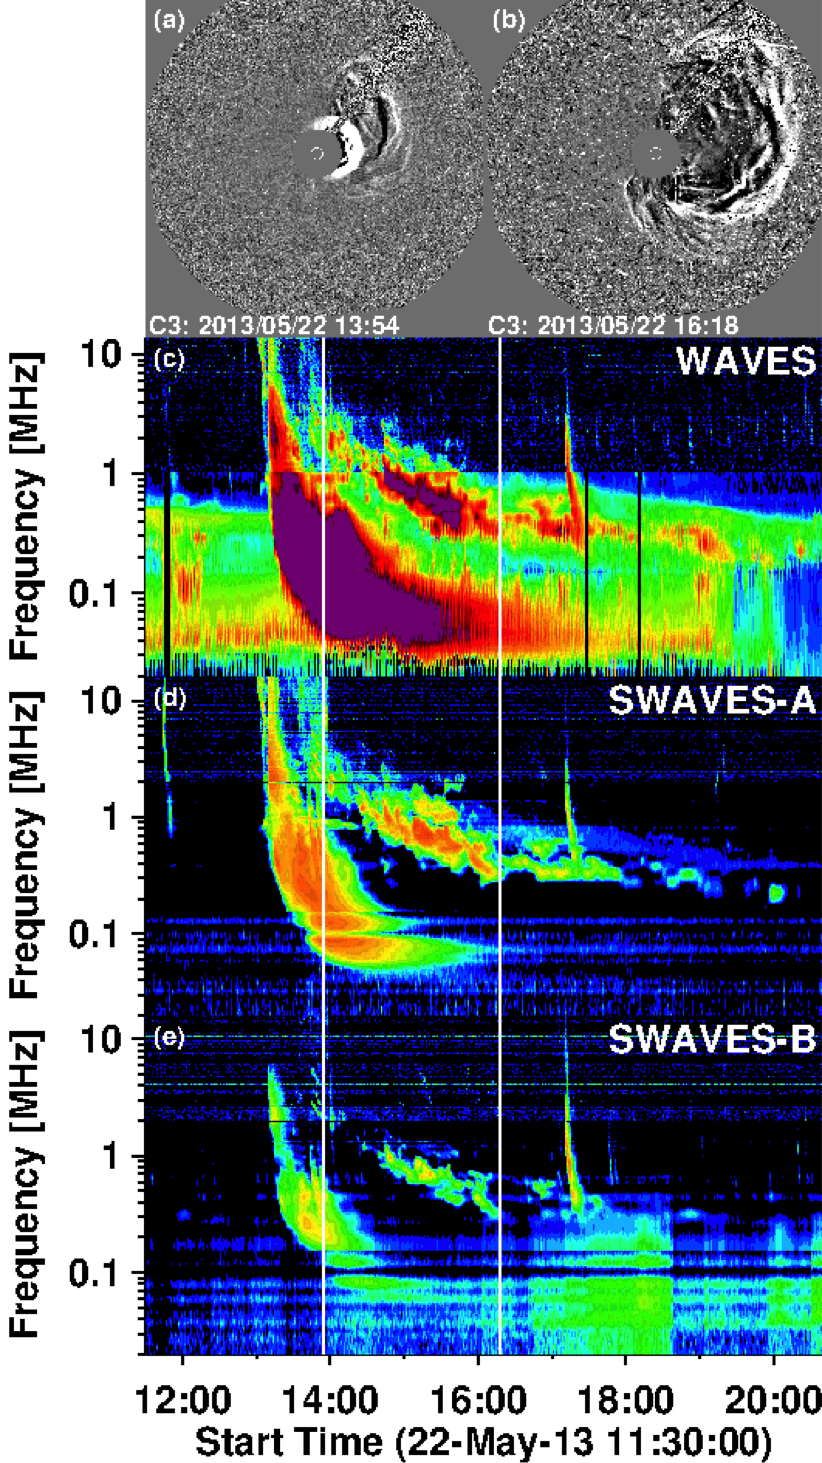
Figure 1. (Top) LASCO/C3 running difference images showing the two CMEs on 2013 May 22 at (a) 13:54 UT and (b) 16:18 UT. The white circle plotted on the gray occulting disk at the center of the image depicts the solar disk. The three panels below the LASCO images show (c) Wind/WAVES, (d) STEREO-A/WAVES, and (e) STEREO-B/WAVES radio dynamic spectra. The white vertical lines mark the times of the LASCO/C3 images and they approximately delimit the main enhancement of the DH type II emission due to the CME–CME interaction. The DH type II burst was preceded by a strong type III burst starting around 13:10 UT.
Triangulation of the DF measurements from STEREO spacecraft
Figure 2 shows the spatial location of the radio source projected onto the ecliptic plane obtained by triangulation of the DF measurements from identical STEREO Ahead (STEREO-A) and Behind (STEREO-B) spacecraft. The source region is seen to propagate towards the STEREO-A spacecraft. The increase of the distance of the radio source from the Sun is also reflected by the decreasing emission frequency, because the type II emission frequency is proportional to the local plasma density, which decreases as distance from the Sun increases.
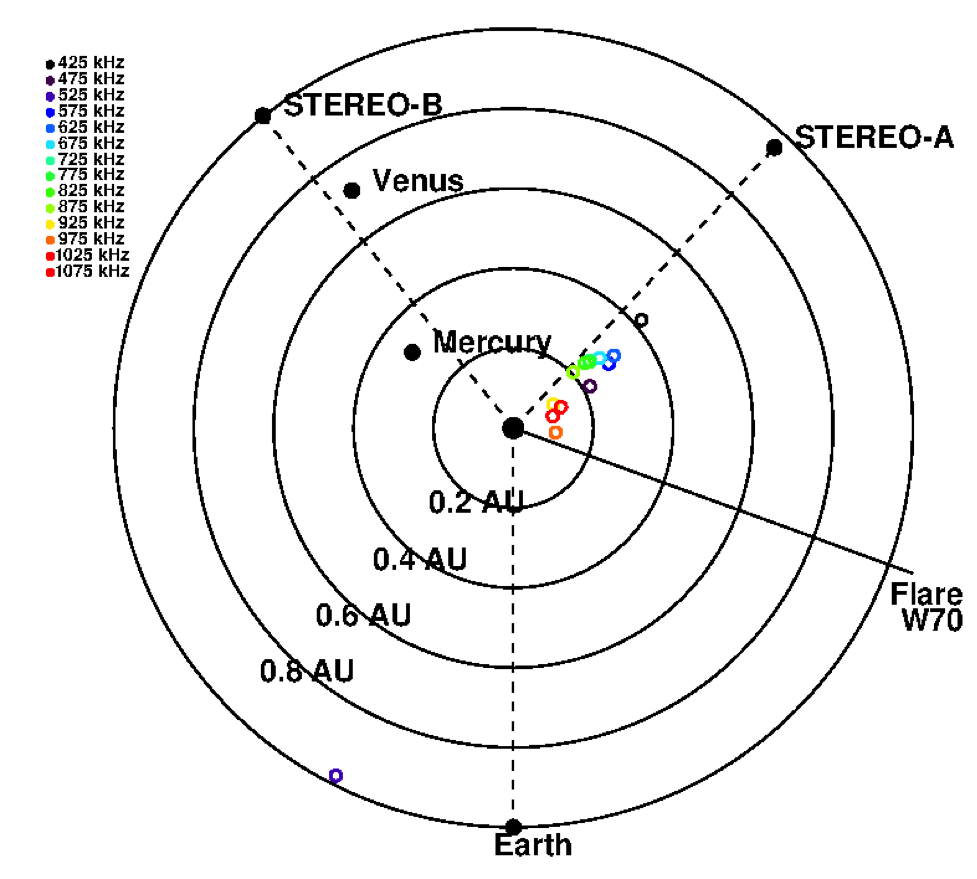
Figure 2. Radio source locations obtained from the direction-finding analysis and triangulation on the STEREO-A and B data. The source locations are projected onto the ecliptic plane. The concentric circles give the radial distance from the Sun. The heliographic longitude of the associated flare and the locations of the inner planets are also marked.
Observed shift in the latitudinal location of the radio source
Figure 3 shows the dynamic spectrum from the Wind/WAVES radio instrument and the DF results from the Wind/WAVES and SWAVES-A instruments at two frequencies of 624 kHz and 625 kHz, respectively. The over-plotted black (white) data points in Fig. 3a that correspond a radio source to south (north) of the ecliptic direction indicate that the latitudinal location of the radio source shifts from north of the ecliptic to south of the ecliptic and then to return briefly before the end of the DH type II burst. At most frequencies the first phase of the type II enhancement was dominated by a radio source more toward the north.
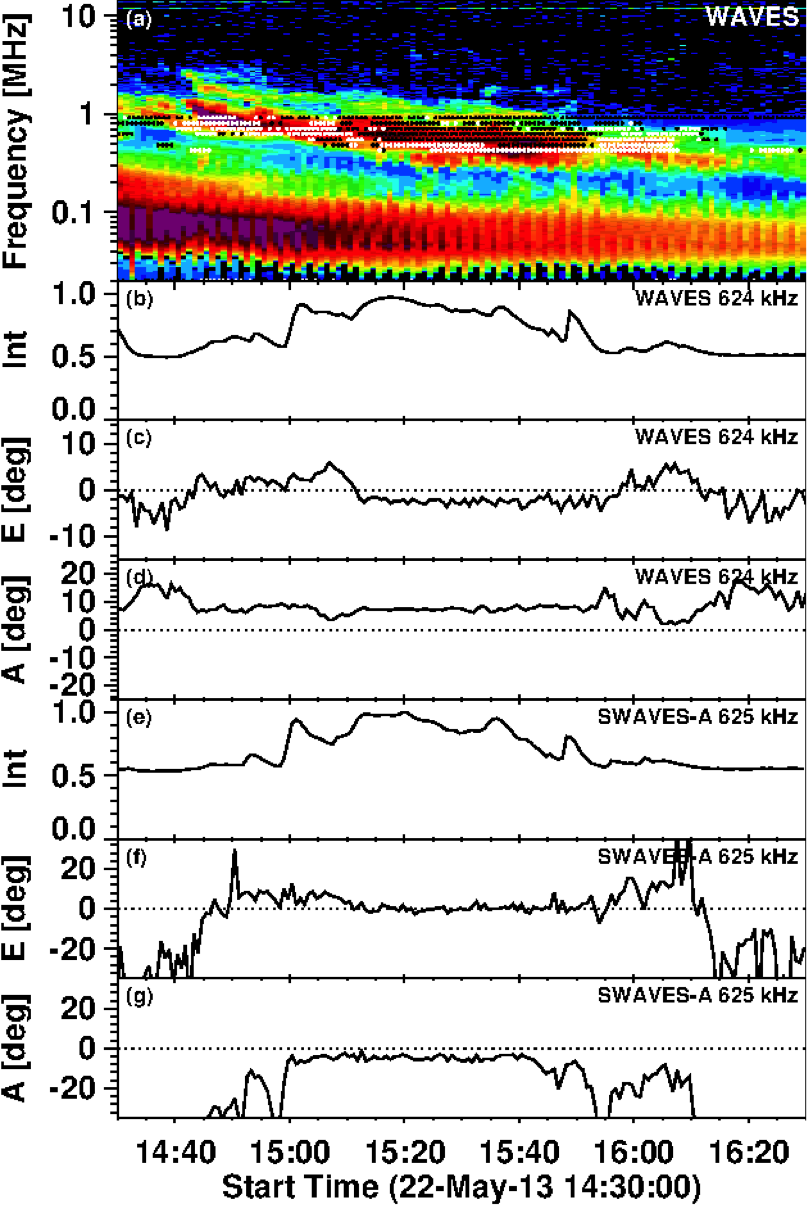
Figure 3. (a) Wind/WAVES radio dynamic spectra over-plotted by data points that indicate the radio source latitudinal locations for each DF frequency. The black (white) points correspond to the source location south (north) of ecliptic. The bright feature visible below the DH type II burst is the low-frequency section of the strong type III burst. The panels below the dynamic spectrum show the normalized intensity (Int), the elevation (E) above the ecliptic, and the azimuth (A) relative to the Sun–spacecraft line obtained from the DF analysis of the Wind/WAVES (panels (b)–(d)), and STEREO-A/WAVES (panels (e)–(g)) data at the matching frequencies of 626 kHz and 625 kHz, respectively.
Comparison of radio source locations with the white-light images of CMEs
In Figure 4, the WIND/WAVES source directions are over-plotted on the running difference images of CMEs obtained by LASCO/C3 coronagraph on board SOHO spacecraft. We see that at the lower frequencies below ∼800 kHz the radio source locations are not near the leading edge of the CME (the bright feature in the images). The shift away from the Sun is due to scattering of the radio waves in the interplanetary medium. The waves at the lower frequencies scatter more than those at higher frequencies. Therefore, the source locations at the three highest frequencies are not shifted as much, and they are near the leading edge of the primary CME, indicating that the most likely source location of the type II enhancement is the CME–CME interaction region.
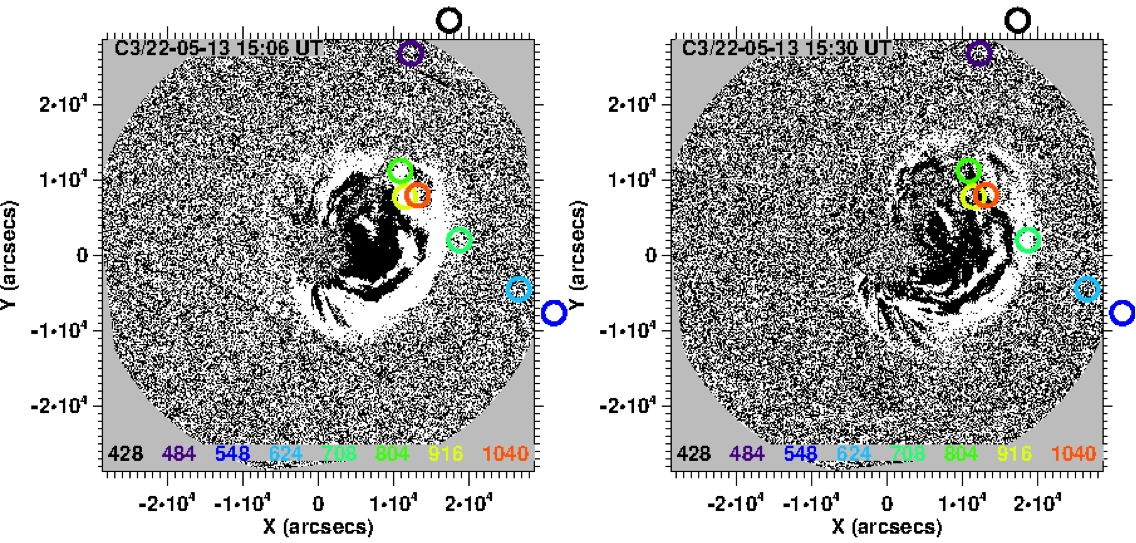
Figure 4. DF source directions (circles) estimated from the Wind/WAVES data over-plotted on the LASCO/C3 running difference images at 15:06 UT and 15:30 UT. The colored numbers at the bottom indicate the corresponding frequencies in kilohertz. The white circle plotted on the gray occulting disk at the center of the image depicts the solar disk.
Conclusions
Our analysis of the DF directions determined from the Wind/WAVES measurements around 1MHz showed that the location of the leading edge of the primary CME seen in the white-light images of the LASCO/C3 coronagraph matches the radio source locations of the type II enhancement. This correspondence at radio and white-light wavelengths confirms that the type II enhancement originates from the CME–CME interaction region. We also found out that the latitudinal location of the type II radio source shifted during the radio enhancement, indicating that the spatial location of the dominant source varies during the CME-CME interaction. At frequencies below 800 kHz the radio source locations appeared to be shifted away from the CME leading edge and the Sun due to scattering of radio waves. Results from triangulation of the radio source directions from the two STEREO spacecraft showed that the dominant radio source propagated towards the STEREO-Ahead spacecraft.
References
Gopalswamy, N., Yashiro, S., Kaiser, M. L., Howard, R. A., & Bougeret, J.-L. 2001, ApJL, 548, L91
Mäkelä, P., Gopalswamy, N., Reiner, M. J., Akiyama, S., Krupar, V. 2016, ApJ, 827, 141
*Full list of authors: P. Mäkelä, N. Gopalswamy, M. J. Reiner, S. Akiyama and V. Krupar
Further details can be found:
Mäkelä, P., Gopalswamy, N., Reiner, M., Akiyama, S., & Krupar, V. (2016). SOURCE REGIONS OF THE TYPE II RADIO BURST OBSERVED DURING A CME–CME INTERACTION ON 2013 MAY 22 The Astrophysical Journal, 827 (2) DOI: 10.3847/0004-637X/827/2/141