The acceleration of charged particles is an ubiquitous phenomenon in solar flares. Non-thermal electrons are especially probed by their hard X-ray (HXR) and radio emissions. Most flare analyses concern the impulsive flare phase, where the X-ray signatures are the most intense (i.e., the time range between the start and peak time of the soft X-ray burst).The post-impulsive phase of eruptive flares with its signatures of destabilization and the eruption of large-scale coronal structures and a re-arrangement of the corona in its wake led to a standard flare scenario, with the build-up of a magnetic flux rope, its instability or loss of equilibrium, and magnetic reconnection in its wake that create signatures of time-extended energy release such as long-lasting thermal X-ray emission and growing loop systems in X-rays, EUV and Hα. Non-thermal signatures of time-extended energy release in the post-impulsive phase can also be observed (Yu 2020) in the form of weak microwave and HXR emissions from electrons accelerated in magnetic reconnection events in the post-eruptive current sheet.
The recent study by Zhang et al. (2025) investigated the relationship between X-rays and radio-emitting electrons in the post-impulsive phase of an eruptive solar flare on 9 May 2021. Such studies have been performed in the past (see the first studies by Svetska et al. (1982) and e.g. White et al. (2011) for a review). However, long duration events were always difficult to analyze in X-rays because of frequent occultations of the Sun to the spacecraft in a low-Earth orbit. Solar Orbiter now offers the unique advantage of solar observations over long durations without any occultation.
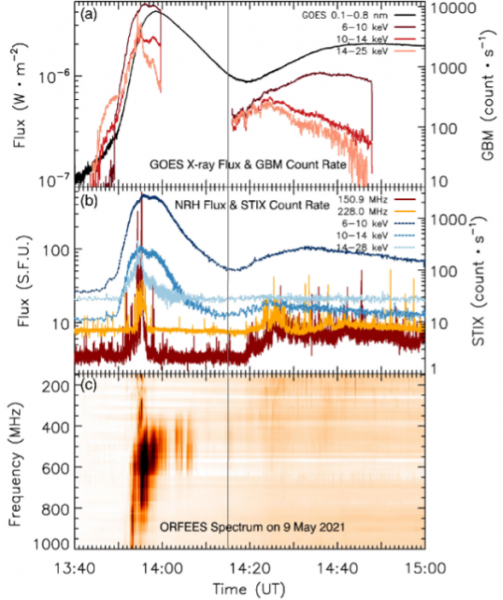
Figure 1. Overview of the event observed in X-ray and radio. (a) GOES soft X-ray flux profile and GBM/Fermi X-ray count rates. (b) STIX X-ray count rates and NRH radio flux time profiles. The NRH radio flux profiles come from the full Sun. (c) ORFEES radio dynamic spectrum.
The present study is based on the analysis of an event which is a usual C4.0 class flare, but has a post-impulsive phase that lasts for more than fifty minutes from 14:10 to 15:00 UT and is accompanied by moving and stationary type IV bursts (shown in Figures 1 and 2). We used data from two ground-based radio instruments at decimeter-to-meter wavelengths (ORFEES and NRH) and five space-borne instruments (STIX/SolO, GBM/Fermi, GOES, AIA/SDO and EUVI/STEREO-A). This gives us a broad spectral and imaging range at X-ray, EUV and decimeter-to-meter wavelengths. While ground-based and SDO observations provided flare information as viewed from the Earth, Solar Orbiter, and STEREO-A provided information from two different points of view. The angle between Solar Orbiter and Earth is 97.5° and between STEREO-A and Earth, it is 52.0°.
Figure 1 shows an overview of the event observed in X-ray and radio wavelengths. The GOES X-ray time profile shows a C4.0 class flare with an impulsive phase peaking at 13:58 UT and decaying until 14:09 UT. After the decay from the main peak, the flux rises again up to the C2.0 level. The X-ray count rates in the 6–25 keV range also increase after 14:17 UT and remain on an enhanced level until at least 15:00 UT. The EUV observations at the time of the new rise in X-rays show that the associated energy release occurs in the same active region and is the continuation of phenomena observed during the flare impulsive phase. The entire emission between 13:38 and (at least) 15:00 UT is thus considered here as a single flare and the time period after 14:15 UT is referred as post-impulsive phase. The ORFEES radio dynamic spectrum shows that the post-impulsive radio emission consists of a long duration emission that starts with the X-rays around 14:15 UT and lasts more than 45 minutes. This type IV continuum covers the entire ORFEES band, with some fine structures superposed.
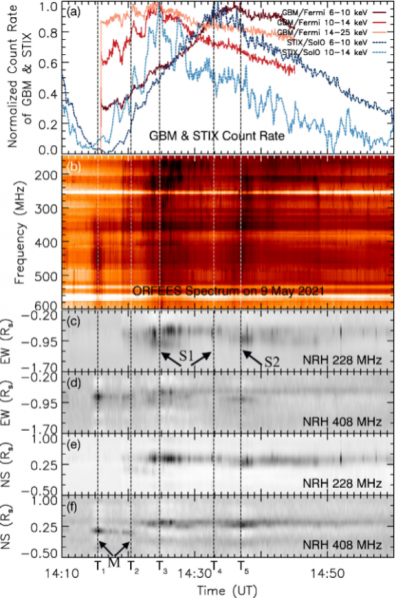
Figure 2. Post-impulsive phase of the C4.0 flare event observed in X-ray and radio. (a) Normalized time profiles of GBM/Fermi and STIX X-ray count rates. (b) ORFEES radio dynamic spectrum. (c) to (f) time evolution of the NRH 1D projection images.
Figure 2 shows the event observed in X-ray and radio wavelengths during the post-impulsive phase. The peak time above 10 keV is shortly before 14:25 UT (time T3). Below 10 keV, the time evolution of the X-ray flux is more gradual and the maximum is rather flat. The ORFEES dynamic spectrum shows radio fine structures superposed on the long-lived continuum type IV emission. The comparison of Figures 2a and b shows that the long-duration radio emission is co-temporal with HXR emission above 10 keV. The strongest radio emission is observed close to the time of HXR peaks (either below or above 10 keV). The time evolution of the 1D projection images (Figures 2c to 2f) show that different components in the type IV radio burst can be distinguished during the post-impulsive phase: 1. A moving type IV burst (the first radio source) between 14:15 and 14:21 UT observed especially at frequencies > 228 MHz, marked as ‘M’ in Fig. 2f (time interval of T1–T2). 2. A stationary type IV burst that starts around 14:20 UT and lasts until 15:17 UT (end of the NRH observations). It is marked as ‘S1’ in Fig. 2c during the time of T3–T4. This stationary type IV burst is not at the position of a pre-existing radio noise storm source observed before the C4.0 flare, which is located more to the west, at least at the highest NRH frequencies. 3. Two sources are sometimes observed (especially at high frequencies) during the stationary type IV burst. The north western one is the more persistent one (S1). The southeastern one (the third radio source, referred to as ‘S2’) displays a series of bursts (e.g., at 14:36:55 UT (time T5)). It is marked by ‘S2’ in Fig. 2d at the time of T5.
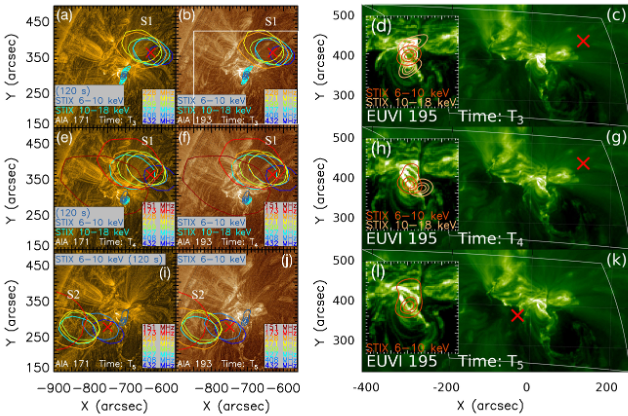
Figure 3. Flare seen from the Earth and STEREO-A points of view. (First and second columns) NRH radio contours are overlaid on the AIA images. The times of each row are similar, corresponding to the time of the black (or white) long dashed lines in Fig. 2. The red crosses show the same position in the AIA and EUVI images. For the first row, the radio burst times are at T3. For the second row, the radio burst times are at T4. For the last row, the radio burst times are at T5. (Last column) the insert on the bottom left shows an enlargement of the active region observed in EUV. STIX contours rotated to the AIA (or STEREO) field of view are overlaid on the AIA (or STEREO) images.
Figure 3 shows the radio and X-ray contours after the end of the moving type IV burst overlaid on EUV images. The first and second rows show the positions of the main source of the stationary type IV burst (S1) respectively at T3 (peak time of the X-ray emission above 10 keV) and T4. While the radio emission gradually extends to lower frequencies, the source locations at individual frequencies are stable from 14:24 to 14:34 UT. The radio positions are relatively close to the active region and localized towards its northern part. The last row is at 14:36 UT (T5 in Fig. 2), for some time when the radio source S2 becomes predominant. The source of the second component S2 of the stationary type IV burst is close to the position of the southern part of the X-ray source, which dominates the X-ray emission at that time.
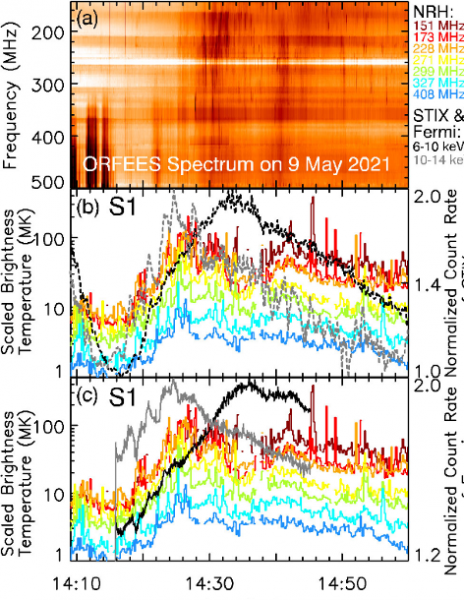
Figure 4. Time profile of the brightness temperature of the main source of the stationary type IV radio sources (S1) from 14:09 to 15:00 UT. The top panel is the ORFEES spectrum. The middle panel is the brightness temperature time profiles of S1 and the STIX X-ray count rate in the 6–10 and 10–14 keV energy ranges. The bottom panel is the same S1 brightness temperature curves as the middle panel and GBM/Fermi X–ray count rates in the 6–10 and 10–14 keV energy ranges.
Figure 4 shows that the brightness temperature of the stationary type IV burst (S1) rises gradually from 14:15 to 14:25 UT with possible superposed broadband bursts. A peak is clearly seen at high frequencies around 14:25 UT. A dip close to 14:33 UT in the whole frequency band is followed by a new enhancement until 15:00 UT. There is a very strong correlation in the rise phase of X-ray and radio emissions. The first radio peak coincides very closely with the X-ray peak observed by STIX above 10 keV. The second rise of the radio emission after 14:33 UT does not correspond however to a new episode of X-ray emission above 10 keV. The peak of the 6-10 keV time profile corresponds to the dip of the radio emission. A second X-ray peak in the 6-10 keV range observed around 14:32 UT corresponds however to a second broad radio peak at high frequencies. Similar trends are observed with GBM/Fermi.
Conclusions
- Long-duration radio emission observed during the post-impulsive phase of the May 9, 2021 event is associated with HXR emission above 6 keV. The strongest radio emission occurs at (or near) the times of the HXR peaks.
- The time profile of the brightness temperature of the main source of the stationary type IV burst (S1) has a good temporal correlation with the X-ray emission: the two types of emission have a similar rise phase and there is a good association between the first radio peak and the X-ray peak observed above 10 keV.
- From the X-ray spectral analysis, it is found that non-thermal emission is observed in the active region in the peak observed above 10 keV during the early rise of the stationary type IV source (S1). The electron power law index is steep (δ around – 7.5). The integrated electron flux above 30 kev is on the order of 1.6 × 1032 electron s−1
This is the first time that HXR emission is clearly detected in the active region at the onset of the stationary type IV burst. The present detection of deka-keV electrons in this event also confirms the previous estimation by Salas-Matamoros & Klein (2020) of the energy of the electrons radiating stationary type IV bursts.
As a final conclusion, the observational results presented here demonstrate the importance of combining X-ray and radio observations to get a good understanding of the production of non-thermal electrons in decimetric and metric type IV bursts, as well as on the non-thermal energetics associated with these phenomena.
More details on the analysis of the event can be found in the paper by Zhang et al. (2025).
Based on the recent paper by M. Zhang, N. Vilmer, K. Klein, A. Hamini, D. Paipa-Leon, Y. Zhang and Y. Yan, Non-thermal energy release in the post-impulsive phase of the May 9, 2021 event, A&A, 697, A216 (2025), DOI: 10.1051/0004-6361/202453514
References
Salas-Matamoros, C., & Klein, K. L.: 2020, A&A, 639, A102
Svetska,Z. Hoyng, P. van Tend W. et al.: 1982, SoPh 75 305
White, S.M., Benz, A.O., Christe, S. et al.: 2011, SSRv, 159, 225
Yu, S., Chen, B., Reeves, K. K., et al.: 2020, ApJ, 900, 17
Zhang, M. Vilmer, N., Klein, K.L. et al: 2025, A&A, 697, A216