Solar type II bursts are sporadic emissions characterized by their narrow bandwidth and slow frequency drift in dynamic spectra (Nelson & Melrose, 1985; Vršnak & Cliver 2008; Nindos et al. 2008; Pick & Vilmer 2008). They are attributed to shock waves produced by flare/CME eruptions. However, the association of type IIs with optical or EUV features is not clear; the leading edge or flanks of CMEs, the front of an erupting flux rope, expanding soft X-ray loops, jets, EUV cavities and waves, as well as CME-streamer interactions have been suggested (for a more detailed discussion see Alissandrakis et al. 2021).

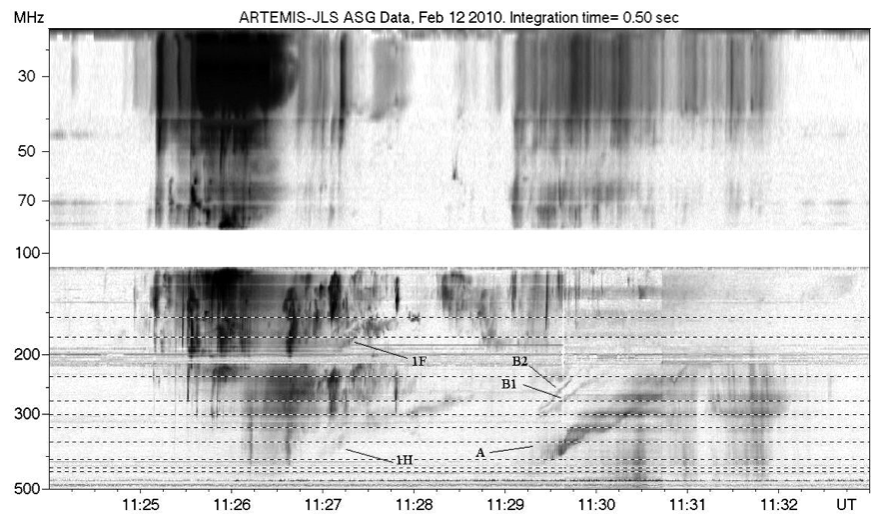
Figure 1. Dynamic spectrum of the February 12, 2010 event, recorded by the ARTEMIS IV-JLS radio spectrograph. 1F, 1H, A, B1 and B2 mark branches of type II bursts. (from Alissandrakis et al. 2021),
Observations and Analysis
The event analyzed here occurred on February 12, 2010, starting around 11:25 UT, in active region 11046 near the central meridian (N25, E11); it was associated with an M9 flare. In addition to ARTEMIS IV-JLS dynamic spectra and NRH images, we used data from RHESSI, GOES SXI, Hinode XRT, Catania Hα, as well as STEREO A & B, which viewed the event near the east and west limb respectively. No EUV images from SOHO were available.
The dynamic spectrum (Figure 1) was rich in structure. Two phases, verified in GOES and RHESSI light curves, are visible, each one of which had associated type II emission; The type II during the first phase had a prominent fundamental-harmonic structure (1F and 1H in the figure), whereas the one during the second phase showed three branches, B1, B2 and B3.

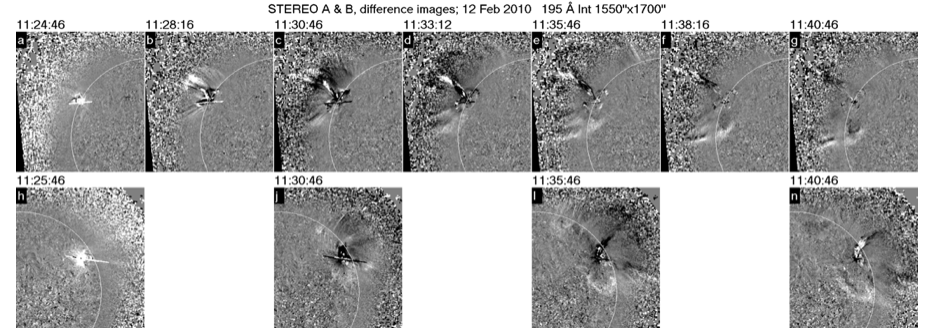
Figure 2. The surge and the EUV wave, in 195 Å STEREO A & B running difference images. The white arc marks the solar limb. (from Alissandrakis et al. 2021),
EUV STEREO images (Figure 2) revealed a large surge and an EUV wave. Surge activity was also detected in the Catania Hα images. White light COR1 images from STEREO A & B show a CME with a radial velocity of ~700 km/s and a streamer disruption.
We determined the 3D structure of the surge through triangulation of STEREO A & B images. Projection of the surge position on the NRH images showed that the type IIs were not associated with the surge. The same conclusion was reached by projecting the type II positions on the STEREO A images, after estimating the height of the radio emission from the observing frequency and a coronal model (Figure 3). Based on computations for homogeneous models (Kontar 2021, private communication), we did not apply any refraction and scattering corrections to the position of the radio sources. We note in Figure 3 that the projection of the type II positions is near the edge of the 195Å EUV wave, which suggests a possible association.
 Figure 3. Derived positions of the type IIs plotted on 195 Å STEREO A running difference images for the first (left) and the second phase of the event. (from Alissandrakis et al. 2021),
Conclusions
Although, at first glance, the surge appeared to be a good candidate for association with the type II emissions, our analysis showed that it was not. The positions of both type-II bursts are broadly consistent with the EUV wave whose generation and development were presented in Figure 2. Still, we consider the surge as a reliable candidate for driving the EUV wave. The association of two separate type II bursts with the same EUV wave indicates that each type II was related with different parts of the wave. The three-dimensional structure of the Alfvén speed above the active region as well as the magnetic field configuration that would favor the acceleration of electrons at distinct locations of the shock front might have also contributed to the appearance of the type-II sources at the observed positions.
In addition to the origin of the type-II emission, our analysis of the radio observations gave a number of interesting results: Using cross-correlation we measured the frequency ratio and the time delay between emission at the plasma frequency and its harmonic during the first type II burst; we found values of 1.95 and 0.23 to 0.6 s, respectively. We also observed pulsations superposed on the second type-II burst. The pulsations were broadband with a bandwidth of about 200MHz and they started before the type II.
This work highlights the importance of imaging spectroscopy for understanding the physics of solar radio emission.
Based on a recent paper: Alissandrakis, C. E., Nindos, A., Patsourakos, S., Hillaris, A, 2021, A&A, 654, A112. doi:10.1051/0004-6361/202141672
References
Nelson, G. J., & Melrose, D. B. 1985, in Type II Bursts, eds. D. J. McLean, & N. R. Labrum, 333
Nindos, A., Aurass, H., Klein, K.-L., & Trottet, G. 2008, Sol. Phys., 253, 3
Pick, M., & Vilmer, N. 2008, A&ARv, 16, 1
Vršnak, B., & Cliver, E.W. 2008, Sol. Phys, 253, 215
*Full list of authors: Costas Alissandrakis, Alexander Nindos, Spiros Patsourakos, Alexander Hillaris
