Magnetic flux ropes are believed to be the centerpiece of the three-part structure of coronal mass ejections. In the standard model of eruptive solar flares, flux rope eruption also induces the impulsive flare energy release through magnetic reconnection. Signatures of flare-associated flux ropes in the low solar corona have been frequently reported in extreme ultraviolet (EUV) wavelengths, particularly the so-called EUV “hot channel” structures (see, e.g., Cheng et al. 2017 for a review). However, reports of the nonthermal counterpart of the erupting flux ropes in the low solar corona are relatively rare.
Here we report microwave spectral imaging of a flux rope eruption associated with the celebrated X8.2 limb flare event on 2017 September 10 (see a collection of relevant papers on ADS) based on data from the Expanded Owens Valley Solar Array (EOVSA). Complemented by EUV and X-ray data, our observations reveal a detailed picture of the flux rope illuminated by flare-accelerated nonthermal electrons. These data also allow us to diagnose the magnetic properties of the flux rope and the nonthermal electrons in a broad flare region.
The Preexisting Filament
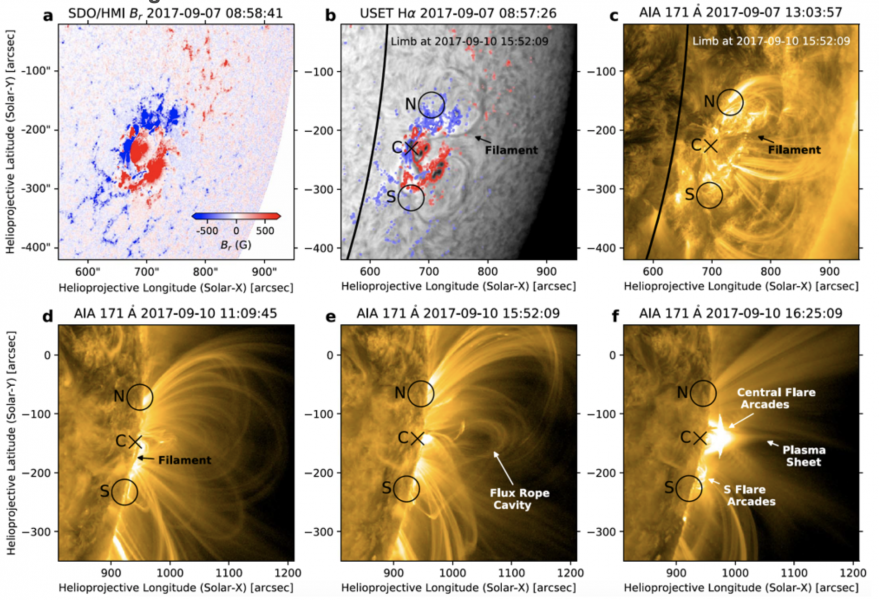 Figure 1 – Preexisting filament that led to the SOL2017-09-10 GOES X8.2-class eruptive flare. (a) Photospheric magnetogram on 2017 September 7. (b) A filament is seen as a reverse S-shaped dark structure in H-alpha image close to the polarity inversion line. (c)–(f) SDO/AIA 171 Å images of the dark filament seen against the disk (c), ∼5 hr prior to the X8.2 event (d), during the eruption (e), and after the flare peak (f). Symbol “X” marks the center of the filament. Circles marked with “N” and “S” denote the northern and southern footpoints of the filament/flux rope, respectively.
Three days prior to the event when the active region was viewed against the disk, a reverse S-shaped filament was seen in both the H-α and SDO/AIA 171 Å images (Figure 1). The filament was located along the polarity inversion line (PIL) of the main sunspot groups. The northern and southern ends of the filament were anchored near the edge of the sunspot group (marked by circles). Near the central active region (marked by a symbol “X”), the filament and the PIL display a sharp turn from a north–south orientation toward the east–west orientation. When the filament rotated to the west limb on 2017 September 10, the central part of the filament was then aligned nearly along the line of sight. When the eruption occurred, this location was directly below the erupting dark cavity. The latter implicates that the erupting flux rope at this central location was viewed along its axis, consistent with the geometry of the preexisting filament.
Flux Rope Eruption: EUV Hot Channel and Microwave Counterpart
When the filament erupted early in the SOL2017-09-10 X8.2 flare event (at ~15:46 UT), it was visible as a hot channel structure in AIA 131 Å images (Figure 2(a)–(d)). The hot channel structure was nearly parallel to the limb, consistent with the overall north–south geometry of the reverse S-shaped filament when viewed against the disk. At the center of the hot channel structure, a bright core was present, connected by strands linking to the footpoints identified from the preexisting filament (circles, same as those in Figure 1). Soon the central core developed into a teardrop-shaped cavity. A long and thin plasma sheet appeared below the cavity, which is the signature of a large-scale reconnection current sheet (see our other recent paper Chen et al. 2020 and references therein).
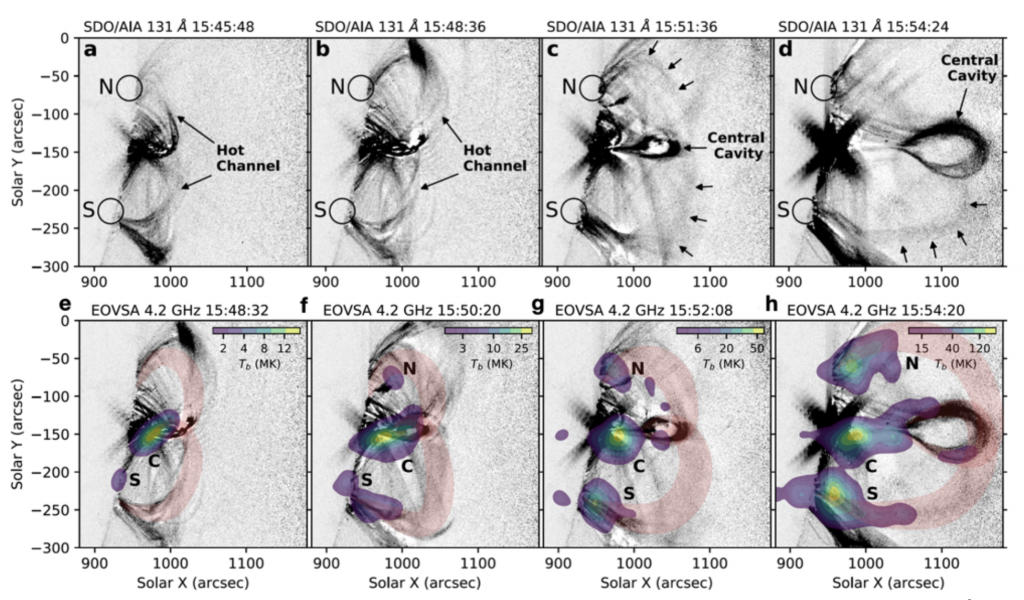 Figure 2 – (a)–(d) Erupting magnetic flux rope seen as a hot channel structure in SDO/AIA 131 Å passband sensitive to ∼10 MK plasma (shown in reverse grayscale). (e)–(h) EOVSA 4.2 GHz microwave sources superposed on SDO/AIA 131 Å.
EOVSA observed the event from ∼14:30 UT to 01:10 UT of the next day (Gary et al. 2018). We adopted a multifrequency synthesis imaging technique to increase the dynamic range of the images. The results are shown in Figure 2(e)–(h). The microwave images at 4.2 GHz showed a striking similarity in morphology to the EUV hot channel structure. In particular, at ~15:54 UT during the early impulsive phase, the image showed a faint cavity-shaped structure encompassing the hot channel cavity. Moreover, both the northern and southern microwave sources showed a clear extension from the flux rope footpoints toward higher heights, which also appeared to follow the hot channel strands connecting to the cavity.
We also derive spatially-resolved microwave light curves and spectra for the central source and the double flux rope footpoints sources. The light curves display very similar temporal evolution since the onset of the flare. The spectra of the three sources show that they are due to gyrosynchrotron radiation from nonthermal electrons, which have similar spectral indices (see Figure 4 of the paper). Both phenomena suggest that the central and side sources are physically connected, probably by nonthermal electrons propagating along magnetic field lines of the erupting flux rope.
Discussion and Conclusion
Our observational results are broadly consistent with the magnetic topology and the associated energy release scenario suggested in the 3D standard model for eruptive flares (Aulanier et al. 2012, 2013; Janvier et al. 2013, 2014). A schematic picture is shown in Figure 3. During the early eruption phase, the pre-reconnection field lines are highly sheared. While the inner ends of these field lines are rooted close to the polarity inversion line and reconnect at the central current sheet, their far ends are rooted near the legs of the flux rope. After the reconnection, the newly reconnected field lines above the primary reconnection X point join the flux rope and add to its magnetic flux. The other set of the reconnected field lines below the X point, in turn, form the main flare arcade. The majority of nonthermal electrons are presumably accelerated at or below the central current sheet and escape along the newly reconnected field lines. Those traveling upward can gain access to the outer shell of the flux rope and propagate back to the solar surface near the flux rope footpoints. Hence, microwave sources can be detected at both the central current sheet region, near the flux rope cavity, and near the flux rope footpoints, all of which are vividly shown in the EOVSA images.
We note that double nonthermal side sources near the flux rope footpoints were previously depicted in the celebrated semi-3D standard flare cartoon by Shibata et al. (1995), and more recently, in the double-arc instability scenario proposed by Kusano et al. (2020). However, to our knowledge, reports of these remote side sources have been elusive. In this event, no HXR counterpart is found at the flux rope footpoints, which is possibly due to 1) the limited dynamic range of RHESSI, and 2) the relatively shorter propagation distance of the X-ray emitting electrons due to Coulomb collision losses. Our observations demonstrate the unique power of microwave spectral imaging in exploring the energy release, electron acceleration, and electron transport processes throughout the flaring region.
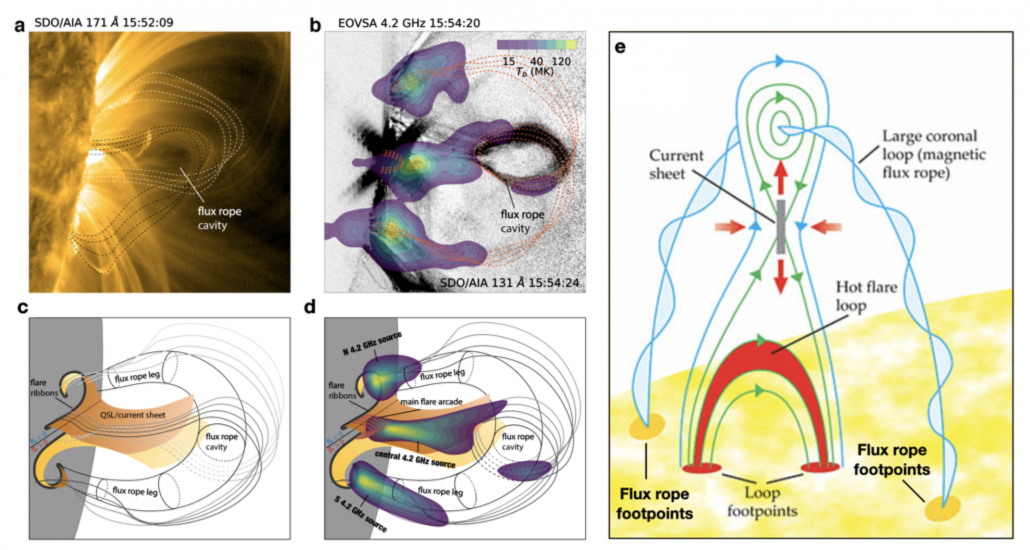 Figure 3 – Schematic of the observations within the context of the 3D standard model for eruptive solar flares. (a) SDO/AIA 171 Å image just before the flare impulsive phase, showing pre-reconnection loops surrounding the flux rope cavity. (b) Composite EOVSA 4.2 GHz and 131 Å image during the impulsive phase (same as Figure 3(d)). (c) and (d) Schematic for the pre-impulsive and post-reconnection scenario adapted from Janvier et al. 2014. (e) Schematic of the standard model adapted from Shibata et al. 1995 (and Holman 2012).
*Based on the recent paper: Bin Chen, Sijie Yu, Katharine K. Reeves, Dale E. Gary (2020) “Microwave Spectral Imaging of an Erupting Magnetic Flux Rope: Implications for the Standard Solar Flare Model in Three Dimensions”, 2020, The Astrophysical Journal Letters, 895, L50. DOI: https://doi.org/10.3847/2041-8213/ab901a; Preprint: https://arxiv.org/abs/2005.01900
References
Aulanier, G., Janvier, M., Schmieder, B. 2012, A&A, 543, 110
Aulanier, G., Démoulin, P., Schrijver, C., et al. 2013, A&A, 549, 66
Chen, B., Shen, C., Gary, D. et al. 2020, Nature Astronomy, 10.1038/s41550-020-1147-7
Cheng, X., Guo, Y., Ding M. 2017, ScChD, 60, 1383
Gary, D., Chen, B., Dennis, B., et al. 2018, ApJ, 863, 83
Holman, G. 2012, Physics Today, 65, 56
Janvier, M., Aulanier, G., Pariat, E., Démoulin, P. 2013, A&A, 555, 77
Janvier, M., Aulanier, G., Bommier, V. et al. 2014, ApJ, 788, 60
Kusano, K., Iju, T., Bamba, Y., Inoue, S. 2020, Science, 369, 587
Shibata, K., Masuda, S., Shimojo, M. et al. 1995, ApJL, 451, L83