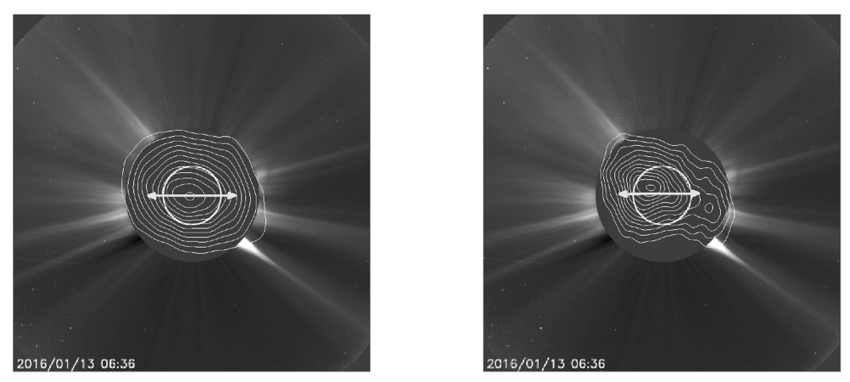
The shape, size and electron density (Ne) of the corona varies with the sunspot cycle, which is now very well established by white-light observations. In our study, we investigated the ‘quiet’ solar corona (i.e., the corona distinct from emission due to transient and long-lasting discrete sources) at radio frequencies during the descending phase of sunspot cycle 24. We used the radio images obtained with the Gauribidanur RAdioheliograPH (GRAPH; Ramesh1998) at 80 MHz and 53 MHz at the Gauribidanur observatory in the period of January, 2015 to May, 2019. The GRAPH data were carefully selected such that no H$\alpha$ and/or X-ray flares, coronal mass ejections (CMEs), and short/long duration non-thermal radio burst activities were reported during our observing period as well as for $\approx$30 min before and after the data. Figure 1 shows the GRAPH contours overlapped on LASCO-C2 coronagraph images on January 13, 2016 (a sample day).
Methodology
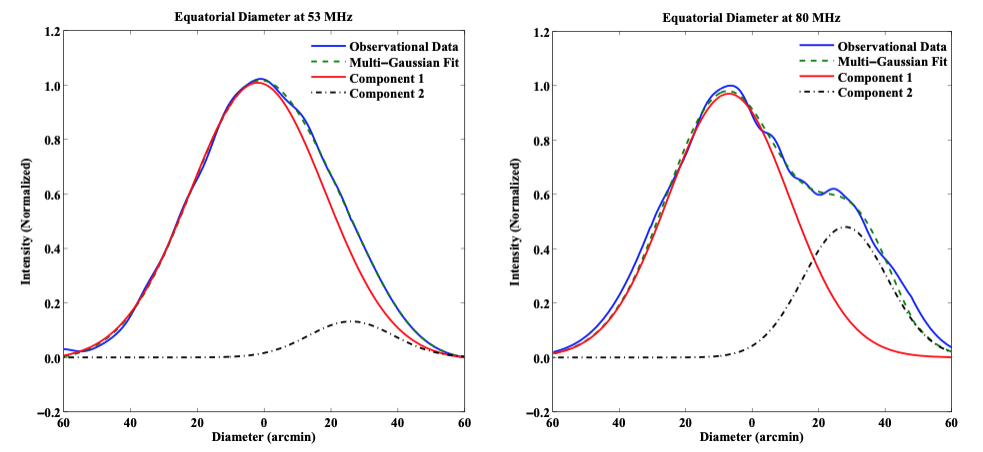
We determined the one-dimensional (1D) equatorial brightness distribution averaged over an angular width of ${\approx}5^{\prime}$ centered on the solar equator in the 2D images obtained with the GRAPH (Figure 1). The equatorial diameter was particularly chosen for the study due to the comparatively better and declination independent angular resolution of the GRAPH in the east-west direction. Each 1D brightness distribution were reproduced using an iterative multi-Gaussian least squares curve fitting technique as described in Ramesh et. at 2006. The minimum width of each Gaussian profile was limited to $1^{\prime}$, the smallest source size reported at frequencies $<$ 100 MHz in previous studies (see for example, Ramesh et. al. 1999, Mugundhan et. al. 2018, Kundu et. al 1990). We imposed the following conditions to consider the data obtained at a particular epoch for further analysis: (i) the fits for the 53 MHz and 80 MHz observations must have one Gaussian profile each with width ${>}32^{\prime}$; (ii) the width of the such a profile in the fit for the 53 MHz observations should be larger than the corresponding 80 MHz profile on the same day; (iii) the discrete solar radio sources identified from the fit should be present at both the frequencies; and (iv) the sum of the amplitudes of the Gaussian profiles used to fit the observed 1D brightness distribution at any given position on the latter should be nearly equal to the observed amplitude there. The Gaussian profiles that satisfied these criteria were considered to represent the ‘background’ corona. We also eliminated the GRAPH beam size contribution from the final diameter values. Figure 2 demonstrates the multi Gaussian fit on a sample data on January 16, 2016 after applying all the criteria mentioned above.

Figure 1 – GRAPH images of the solar corona obtained on 2016 January 13 at 53 MHz and 80 MHz superposed on the SOHO/LASCO-C2 whitelight image obtained on the same day around the same time. Solar north is straight up and east is to the left. The ‘white’ colour open circles represent the size of the solar photosphere. The concentric, filled ‘black’ colour circles indicate the occulting disk of the coronagraph. Its radius is ${\approx}2.2\rm R_{\odot}$.
 Figure 2 – 1D equatorial brightness distribution obtained from the GRAPH radioheliograms at 53 MHz and 80 MHz (see Figure 1) based on the methodology described in Section 3. Two Gaussian profiles, red colour (solid line) and black colour (with dot-dash symbols), were used to match the observations (blue colour profile). The green colour profile (with dash symbols) is the sum of the aforementioned two Gaussian profiles used for the fit. The Chi-square fit errors are $<$1% at both 53 MHz and 80 MHz.
Results and Conclusions
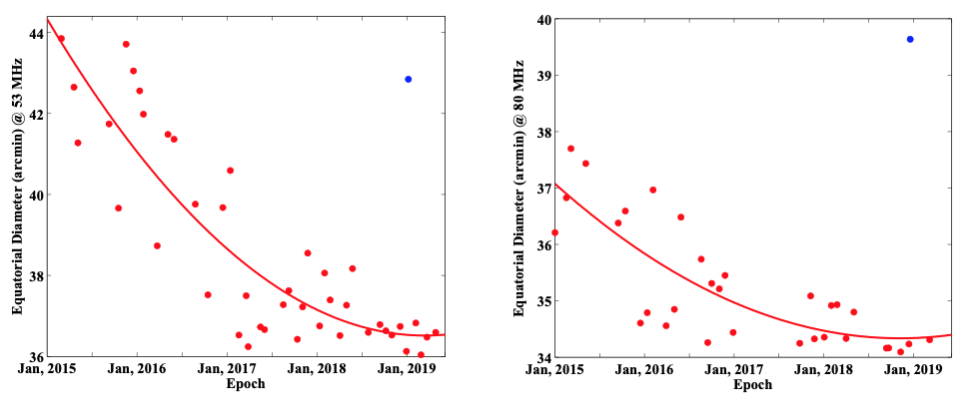
After applying all the criteria on data from January, 2015-May, 2019, we were left with 336 days. Figure 3 shows the monthly minimum values in the equatorial diameters of the solar corona at 53 MHz and 80 MHz during the same period. We chose the monthly minimum values of the diameters since they are more likely to represent the ‘quiet’ solar corona which at low radio frequencies is supposed to be the corona that is nearly free of localized thermal and/or non-thermal sources (Leblanc et. al 1969). The gradual decrease in the equatorial diameters at both 53 MHz and 80 MHz (correlation $\approx$74%) is an indication of the decrease in the heliocentric distances ($r$) of the ‘critical’ plasma levels corresponding to 53 MHz and 80 MHz in the solar atmosphere. We independently estimated $N_{e}$ at the equatorial region of the ‘background’ corona using white-light coronagraph observations and it also suggests a decline ($\approx$1.8 times at $r{\approx}$1.55$\rm R_{\odot}$), consistent with our findings using radio data ($\approx$2.3 times at $r{\approx}$1.16$\rm R_{\odot}$ (80 MHz)). The white-light densities were obtained using the linearly polarized brightness (pB) measurements with STEREO-A/COR1 and the inversion technique based on spherically symmetric polynomial approximation (SSPA; Wang et. al. 2014).
 Figure 3 – The data points in red colour are the monthly minimum values in the equatorial diameters of the solar corona at 53 MHz (left panel) and 80 MHz (right panel) during the period 2015 January – 2019 May. The solid lines in red colour are the quadratic least squares fit to the data points. The isolated blue colour data point indicates the monthly maximum value in the equatorial diameter during 2019 January. It is significantly larger than the corresponding monthly minimum value even during the minimum period of sunspot cycle 24 like the aforementioned epoch.
In this work, we investigated the equatorial diameter of ‘quiet’ solar corona at low radio frequencies during the descending phase of sunspot cycle 24. We identified the localized sources of emission in the radioheliograph data at 80 MHz and 53 MHz and removed those using iterative multi-Gaussian curve fitting technique. Our results shows that the minimum radius of the ‘quiet’ solar corona at a typical frequency like 53 MHz/ 80 MHz was found to be ${\approx}1.16/ 1.1 \rm R_{\odot}$.
Based on the recent paper: Ramesh, R., Kumari, A., et. al.: Low frequency radio observations of the ‘quiet’ corona during the descending phase of sunspot cycle 24. Geophysical Research Letters, e2020GL090426. DOI: https://doi.org/10.1029/2020GL090426
References
R. M. MacQueen, J. T. Burkepile, T. E. Holzer, A. E. Stanger and K. E. Spence (2001). The Astrophysical Journal 549, 1175
R. Ramesh, H. S. Nataraj, C. Kathiravan, and Ch. V. Sastry (2006). The Astrophysical Journal 648, 707
*Full list of Authors: R. Ramesh, Anshu Kumari, C. Kathiravan, D. Ketaki, M. Rajesh, M. Vrunda
