Type III radio bursts from the Sun are signatures of energetic (∼1–100 keV) electrons, accelerated at the reconnection sites, propagating upward through the corona into the interplanetary medium along open magnetic field lines. The emission mechanism of the bursts is widely believed to be due to coherent plasma processes. The bursts are observed typically in the frequency range $\approx 1\,$GHz$ – 10\,$kHz, which corresponds to radial distance range between the low – upper corona; this implies that type III bursts can be used to trace coronal magnetic field over the aforementioned distance range. Type III bursts commonly occur in groups and the individual bursts in a group are due to acceleration episodes occurring at different locations in the same active region (Reid and Ratcliffe, 2014). Observations showing displacements in the centroid of the type III burst during the course of the event are there in the literature (Vlahos and Raoult, 1994). But reports on the correspondence between such changes and locations of the maximum emission in the associated Hα flare (assumed to be the sites of the electron acceleration) are rare. Here, we present simultaneous observations of data from the Gauribidanur Radioheliograph (GRAPH) and the Kodaikanal Halpha data and look for positional shifts in them by inspecting the inter-pixel changes in the respective images.
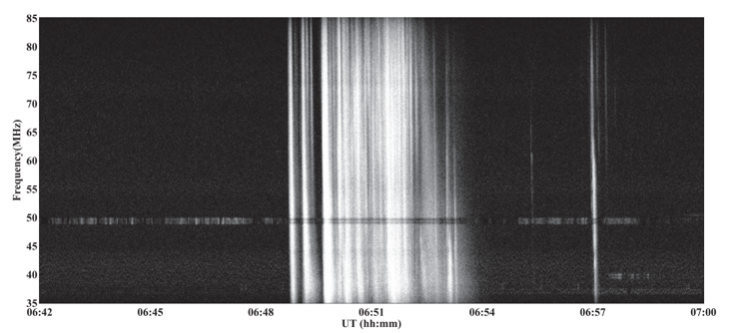
Figure 1 – A Type III group observed by GLOSS
Observations
We use combined radio and Hα observations to study the positional shifts. For the radio observations, we used the Gauribidanur Radioheliograph (GRAPH, FoV ~ 2o and resolution ~ 5’, pixel size ~ 14”), the Gauribidanur Low Frequency Solar Spectrograph (GLOSS, tint ~ 250 ms, BW ~ 2 MHz) and Gauribidanur Radio Interferometric Polarimeter (GRIP, 3o by 90o), which gave us the polarized intensities.
For the Hα data, we used the Kodaikanal telescope, which has a cadence of 1 min. The field of view is ~ 41’ and the pixel size is ~ 1.2”.
Figure 1 shows the GLOSS observations on 2015 January 14 in the time interval 06:42–07:00 UT. The intense patch of emission during ≈06:48–06:54 UT corresponds to a group of type III bursts. The other separate similar bright and faint fast drifting features, but not as a group like the former, close to ≈06:55:30 UT and ≈06:57 UT are isolated type III bursts. There was an SF-class Hα flare on the same day from the active region AR 12259 located at the heliographic coordinates S14W02. The flare was observed during the period ≈06:49–07:04 UT with maximum at ≈06:52 UT. There was also a C2.3-class GOES soft X-ray flare in the time span ≈06:46–06:57 UT. Its maximum was at ≈06:51 UT.5 A comparison of the different timings mentioned above indicates that the isolated type III bursts as well as the group of type III bursts occurred within the flare period.
We traced the positional shifts of the radio and Hα images using centroiding methods (Kontar et al, 2017). For the radio images, we generated maps using AIPS with pixel size of ~ 14”. We identified the source maxima at different times, for different type III bursts for the duration of the group. For similar times, we also used the H-alpha images, identified a region of interest around the active region and estimated the centroids for these as well. We found that the radio and the Hα centroids were scattered around the active region on the solar disk (see Figure 2). Furthermore, we also find that the centroid shifts between the radio and the Hα images show a high correlation (Figure 3).
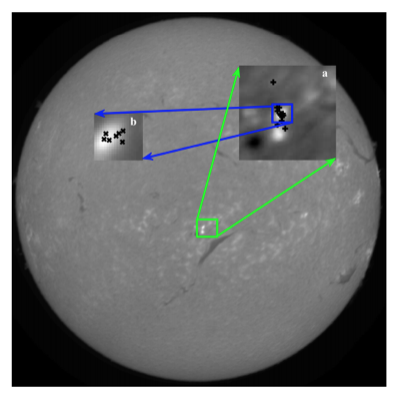
Figure 2 – (a) Positions of the centroids of the Type III group as imaged by GRAPH. The small square (b) shows a zoomed-in view into the positions of the H-alpha centroids.
This clearly indicates that the individual bursts in the type III burst group are due to spatial and temporal fragmentation of the primary energy release near the flare site in the chromosphere as revealed by the Hα observations. The observations of group of type III bursts are the coronal signatures of such a fragmented energy release.
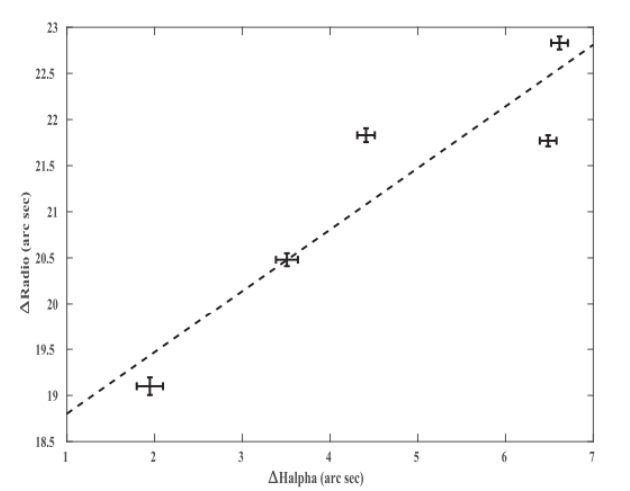
Figure 3 – Correlation between the radio and H-alpha centroid positions.
Conclusions
We have reported the first observational evidence for a correlation between the changes in the centroid positions of a group of type III radio bursts and that of the associated Hα flare emission. Similar optical and radio observations with high spatial resolution would be useful to understand the topic of fragmented energy release better since it has been addressed mostly using time and spectral domain studies to date. The magnetic coupling between the different levels in the solar atmosphere and how the energetic particles are guided through the corona into the interplanetary space could also be probed using such observations.
Based on a recent paper Ramesh, R.; Mugundhan, V.; Prabhu, K., The Astrophysical Journal Letters, 2020, DOI:10.3847/2041-8213/ab6a9c
References
H.A.S. Reid and H. Ratcliffe, 2014, Research in Astronomy and Astrophysics, 14, 7
L. Vlahos and A. Raoult, 1995, Astron. Astrophys. 296, 844
E. P. Kontar, S. Yu, et. al., 2017, Nature Communications, 8, 1515
*Full list of authors: R. Ramesh, V. Mugundhan and K. Prabhu