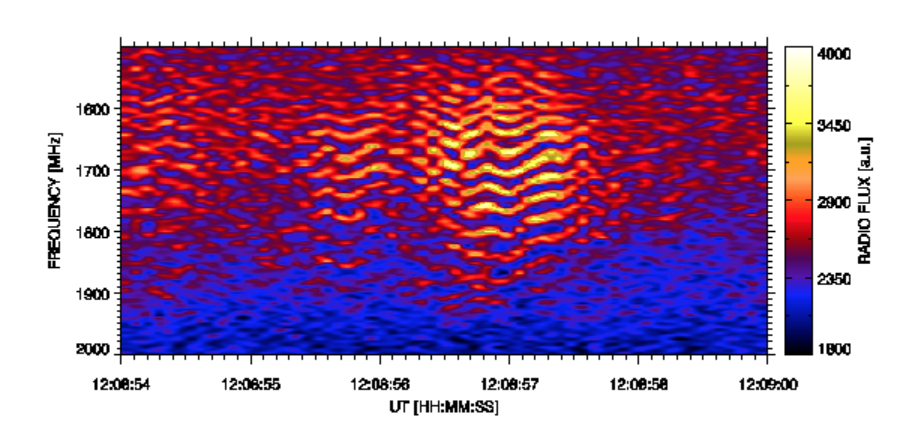
Solar flares are characterized by fast plasma flows. In such plasma flows owing to the Kelvin-Helmholtz instability the maqnetohydrodynamic turbulence can be generated. Although, the turbulence plays an important role in solar flares, e.g., in acceleration of particles, a knowledge about the level of this turbulence is still very limited. In the present study we estimate the levels of this turbulence. For this purpose we use observations of the so called zebra radio bursts. An example of the zebra observed at 14 February 1999 is shown in Figure 1. There are many model of zebras. Here, we use the most promising zebra model that is based on the double-plasma resonance (DPR) instability (Zheleznyakov & Zlotnik 1975; Winglee & Dulk 1986; Zlotnik 2013 ). In this model, the upper-hybrid waves are generated by the DPR instability at locations in the solar atmosphere, where the DPR condition is fulfilled, i.e., $s f_c = f_{uh} = \sqrt{f_p^2 + f_c^2}$, where fuh, fc , and fp are the upper-hybrid, electron-cyclotron and plasma frequencies, and s is the gyro-harmonic number.

Figure 1 Radio spectrum showing the zebra observed by the Ondřejov radiospectrograph at 14 February 1999.
These upper-hybrid waves are then transformed to observed radio waves. We note that in this model, each zebra-stripe source is located at a different place. It enables us to estimate the levels of turbulence in density and magnetic field not only in each zebra-stripe source (time varying turbulence), but also the turbulence level in space among the zebra-stripe sources at a given time (spatially varying turbulence).
Method and results
In the DPR model the ratio of two different zebra-stripe frequencies can be expresses as
\[\frac{f^{s+m}}{f^s} = \frac{s+m}{s} \left(\frac{(s+m)^2 -1 }{s^2 -1 } \right)^{\frac{1}{R – 2}},\tag{1}\]
where fs and fs+m are the zebra-stripe frequencies for the zebra stripe with the gyro-harmonic numbers s and s+m; R = Lb/Ln , where Ln and Lb is the density and magnetic field scale in the density $n$ and magnetic field $B$ profiles
\[n=n_0 \exp^{-\frac{h}{L_{n}}}\;\;\; \text{and}\;\;\; B = B_0 \exp^{-\frac{h}{L_{b}}}, \tag{2}\]
assumed in the zebra source; n0 and B0 are the density and magnetic field at some reference level, and h means the distance along the axis of the source.
Using these relations in the fitting technique described in detail in Karlický and Yasnov (2020) or the method of Karlický and Yasnov (2015) and taking the zebra-stripe frequencies of the 14 February 1999 zebra at 12:08:57 UT (Figure 1, 1548, 1573, 1599, 1619, 1642, 1674, 1707, 1739, 1770, 1810, 1845, and 1880 MHz) we computed the value of the ratio R and the gyro-harmonic number of the zebra stripe with the lowest frequency s1. R is assumed to be constant in the whole zebra source. The computed values of R and s1 were R = 0.625 and s1 = 32. Now knowing the gyro-harmonic numbers of the zebra stripes, zebra-stripe frequencies and using the relations
\[n[\text{cm}^{-3}]=\frac{f_s^2(1-1/s^2)}{8.1 \times 10^{-5}}, \;\;\; B[\text{G}]=\frac{f_s}{2.8 s}, \tag{3}\]
where $f$ is in MHz, we calculated the density $n$ and magnetic field $B$ in the zebra-stripe sources at 12:08:57 UT. By this way we found the density and magnetic field in these zebra-stripe sources to be \( n = (2.95-4.35) \times 10^{10} \) cm-3 and B = 17.2-31.9 G.
Now, let us determine the levels of the time and spatially varying turbulence. In Figure 1 it can be seen that the zebra stripes change their frequencies in time. Taking the zebra-stripe frequencies of continuous zebra stripes at eight equidistant moments in the time interval (12:08:56.7 – 12:08:57.4), i.e., around the time where the gyro-harmonic numbers were determined (12:08:57 UT) and using the relations (3), we calculated time variations of the density and magnetic field in the zebra-stripe sources and thus we determined the time varying turbulence in the density and magnetic field as |Δn/n|t = 0.0112 – 0.0149 and |ΔB/B|t = 0.0056 – 0.0074. Then we compared the zebra-stripe frequencies observed at 12:08:57 UT with those in the ideal DPR model computed from the relation (1), the known value of R = 0.625, and starting from the lowest observed zebra-stripe frequency 1548 MHz with s1 = 32. (We note that the zebra-stripe frequency increases with decreasing gyro-harmonic number.) These sets of observed and ideal model frequencies partly differ. Just these differences are considered to be caused by the spatially varying turbulence. From both these sets of frequencies we computed the density and magnetic field using the relation (3). Finally, from differences in the density and magnetic field corresponding to these sets of frequencies we calculated the spatially varying turbulence in the density and magnetic field as |Δn/n|s = 0.0047 and |ΔB/B|s= 0.0024.
Conclusions
We estimated the density and magnetic field in the zebra-stripe sources as n = (2.95-4.35) x 1010 cm-3 and B = 17.2-31.9 G. Furthermore, we estimated levels of the time and spatially varying turbulence in the zebra stripe sources. The levels in the time varying and spatially varying turbulence differ, the level of the spatially varying turbulence is lower. It indicates some anisotropy of this turbulence, probably caused by the magnetic field structure around zebra-stripe sources. Variations in the density and magnetic field in the zebra-stripe sources were found to be in phase, which indicates that this turbulence is the fast mode magnetosonic turbulence.
Related article: This nugget is based on the recent paper: Karlický, M. and Yasnov, L. 2020, A&A 638, A22
References:
Karlický, M. and Yasnov, L. 2015, A&A 581, A115
Karlický, M. and Yasnov, L. 2020, A&A 638, A22
Winglee, R.M and Dulk, G.A. 1986, ApJ 307, 808
Zheleznyakov,V. V. and Zlotnik, E. Y. 1975, Solar Phys., 44, 461
Zlotnik, E. Y. 2013, Solar Phys., 284, 579
