Observations of the radio continuum at millimeter (mm) wavelengths provide a unique chromospheric diagnostic. The quiet Sun mm-wavelength emission mechanism is free-free and electrons are almost always in local thermodynamic equilibrium (e.g. Shibasaki et al. 2011 and Wedemeyer et al. 2016). The availability of mm-wavelength solar observations with ALMA can advance our knowledge on the chromosphere because of the instrument’s unique spatial resolution and sensitivity. In a previous study (Alissandrakis et al. 2017, see also here), we used ALMA full-disk (FD) commissioning data to study the quiet Sun under low resolution. However, publications of results from ALMA high-resolution quiet Sun observations are rare. We have recently performed the analysis of such observations; our results are reported in Nindos et al. (2018).

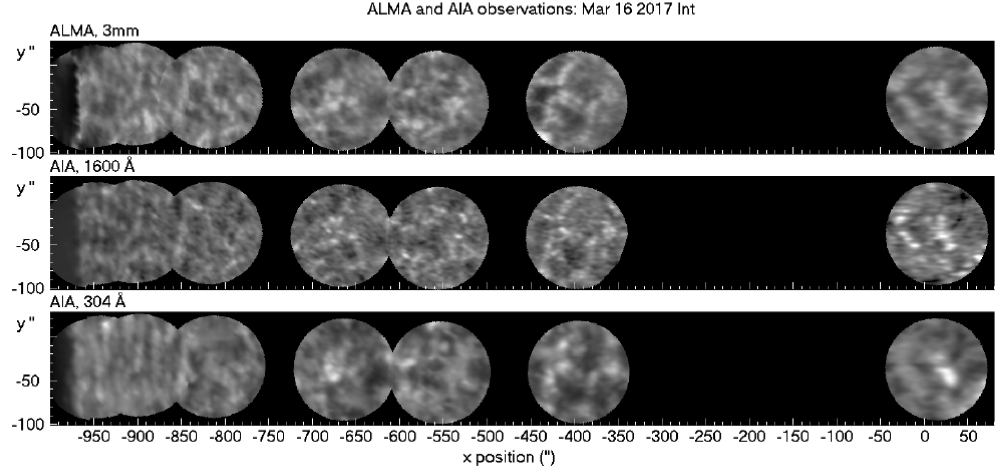
Figure 1: Top row: Composite of the seven 3-mm average ALMA images, corrected for solar rotation and reprojected at the position of their fields of view at 17:55:48 UT. Second and third rows: composites of AIA 1600 and 304 Å images for the same time intervals and fields of view as the ALMA images, convolved with the ALMA beam. ALMA and 1600 Å images are partly corrected for center-to-limb variation. The composites are oriented in the SW direction with respect to Solar North (from Nindos et al. 2018).
Observations and Results
Seven regions were observed at 100 GHz on March 16 2017, from the limb to the center of the disk, along a line at position angle of 135o; each region was observed for 10 min with a cadence of 2 s. The visibilities were calibrated following the method described by Shimojo et al. (2017). Both average and snapshot CLEAN images were produced after self-calibration. Subsequently, all images were combined with a low-resolution FD ALMA image. The spatial resolution we achieved was about 4.5” x 2.5”.
A composite of all average ALMA images, each with a field of view (FOV) of 120” is presented in the top row of Fig. 1; the other rows show similar composites of the corresponding AIA data in the 1600 and 304 Å bands, convolved with the ALMA beam. The chromospheric network is clearly visible at 3 mm; its morphology correlates equally well with the 1600 Å and the 304 Å structures. Moreover, at 100 GHz the structures are larger than at 1600 Å, but not as large as at 304 Å hinting that the radiation is formed in between.
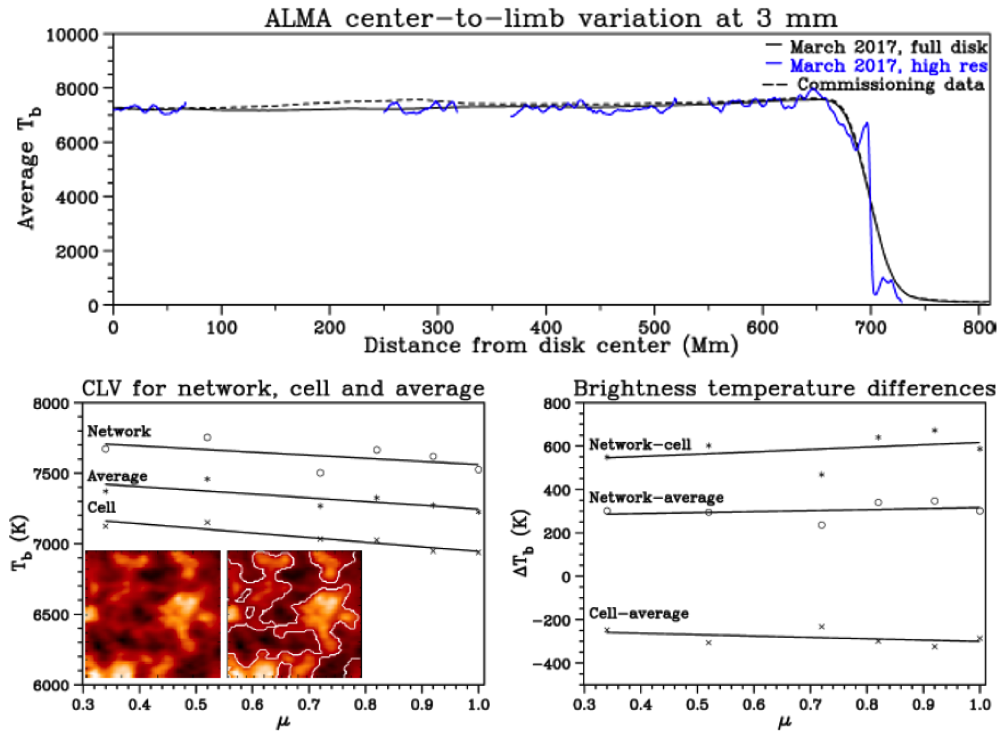
 Figure 2: Top row: Center-to-limb variation from the present and the commissioning full-disk data (full and dashed black curves) and from the interferometric average images with a FOV of 110” (blue curve). Bottom row: Tb of the network, cell interior and average (left) and their differences (right) as a function of μ. The insert shows the inner 80”x80” if a disk target; contours show the network-cell boundaries (from Nindos et al. 2018).
Fig. 2 (top row) shows the average brightness temperature, Tb, derived from the ALMA images as a function of distance from disk center. The high resolution data of Fig. 2 show a moderate limb brightening, ~5” wide, just beyond the photospheric limb.
We quantified the center-to-limb variation (CLV) of the network and cell interior by computing the average Tb of both for the disk targets, as well as the average Tb and its root mean square value. The results are presented in Fig. 2 (bottom row). Both the network and cell interior show limb brightening. Their difference, as well as the difference between the network and the average Tb, decrease marginally towards the limb, while the cell-average difference shows a marginal increase. The network/cell ratio has an average value of 1.08 and decreases slightly towards the limb. On the average, the network is 305±35 K above the average Tb and the intranetwork 285±30 K below.
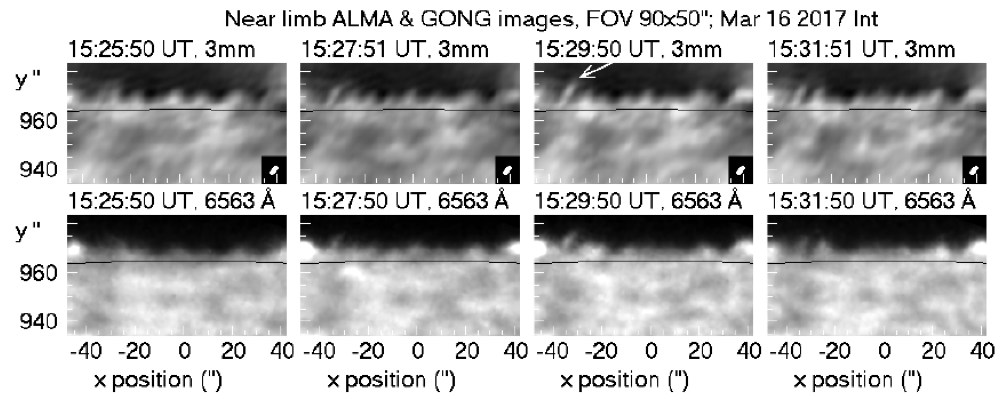
 Figure 3: Spicules seen in near limb images at 3 mm (top) and Hα (bottom). All images have been rotated to make the limb parallel to the horizontal direction. The black curve marks the photospheric limb and the inserts show the ALMA beam (from Nindos et al. 2018).
Spicules are well visible beyond the limb (see Fig. 3). The most prominent one (marked by an arrow in Fig. 3) is visible from ~2” to ~15” above the limb and is most prominent at 8.5”, with Tb = 2560 K, 1800 K above the local background and a width of 4”. Lower down, Tb goes up to 6500 K and the width drops down to 2.4”. Their lifetime is comparable to the 10 min duration of the limb observations. We found no evidence of spicules on the disk, either in emission or in absorption.
Conclusions
The ALMA images show well the chromospheric network, which is brighter than the average by ~305 K while the intranetwork is less bright by ~280 K, with a slight decrease of contrast toward the limb. At 3 mm the network is very similar to the 1600 Å images, with somewhat larger size. We detected spicules rising up to 15” above the limb with a width down to the image resolution and brightness temperature of ~1800 K above the local background. No trace of spicules, either in emission or absorption, was found on the disk.
In subsequent work we intend to exploit the CLV data for two-component atmospheric modeling, elaborate further on the larger size of the structures at 3 mm than at lower heights, and study oscillations and transients.
References
Alissandrakis, C. E., Patsourakos, S., Nindos, A., Bastian, T.: 2017, A&A, 605, A78
Nindos, A., Alissandrakis, C.E., Bastian, T.S., et al.: 2018, A&A (Letters), in press
Shibasaki, J., Alissandrakis, C. E., Pohjolainen, S.: 2011, Sol. Phys., 273, 309
Shimojo, M, Bastian, T.S, Hales, A.S., et al. 2017: Sol. Phys., 292, 87
Wedemeyer, S., Bastian, T., Brajša R., et al : 2016, SSRv, 1, 200
*Full list of authors: Nindos, C.E. Alissandrakis, T.S. Bastian, S. Patsourakos, B. De Pontieu, H. Warren, T. Ayres, H.S. Hudson, T. Shimizu, J.-C. Vial, S. Wedemeyer, V. Yurchyshyn
