Type III solar radio bursts are caused by electron beams accelerated to modest fractions of light speed by magnetic reconnection, the process that drives solar flares. The beams stimulate oscillations in the ambient plasma, which in turn produce short periods of intense radio emission. The standard theory predicts emission at either the fundamental electron plasma frequency (fp) or its harmonic (2fp). These values are proportional to the square root of the background density, and this dependency produces the defining feature of type III bursts, a rapid drift to lower frequencies as the electron beams propagate away from the Sun through lower and lower densities.
In principle, an estimate of the coronal density can therefore be obtained given the position of a type III burst and the emission mode (fundamental or harmonic). However, densities inferred from type III source heights have often conflicted with those obtained from other methods. The earliest measurements suggested densities that were an order of magnitude larger than expected (Wild et al. 1959), and this finding has been replicated multiple times since. There are two main ideas to explain the discrepancy. The first is that electron beams that produce observable emission tend to travel along overdense fibers, and the second is that the observed source locations differ significantly from the true emission sites due to radio propagation effects, namely scattering by density inhomogeneities and refraction.
Observations and Analysis
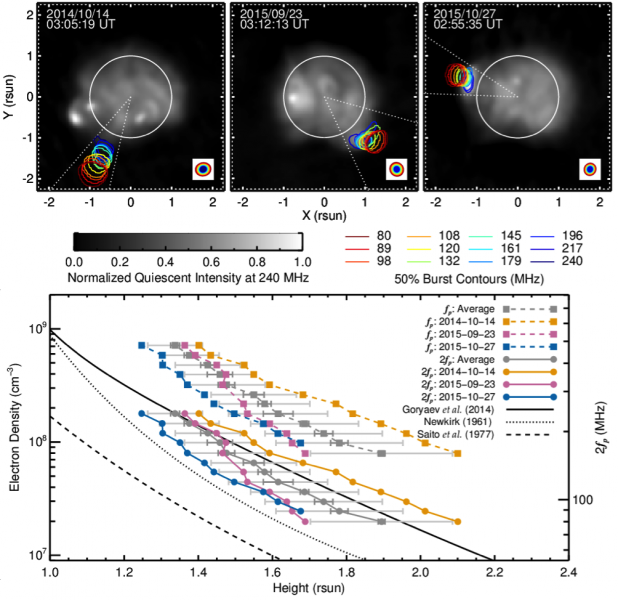
We examined three simple bursts (Figure 1, top) that were observed at the limb by the Murchison Widefield Array (MWA). All three bursts are aligned with dense white-light streamers observed by LASCO at larger heights and plausibly associated with thin extreme ultraviolet (EUV) rays that exhibit activity in SDO observations just after the radio bursts. The bottom panel of Figure 1 shows the density profiles implied by the source heights assuming both fundamental and harmonic plasma emission compared to different density models. As with the previous generations of low-frequency instrumentation, we find large enhancements over standard background models assuming fundamental emission and moderate enhancements assuming harmonic emission.
 Figure 1. Top: MWA Type III burst contours at 50% of peak intensity for each channel overlaid on 240 MHz images of the quiescent corona. The solid circles represent the optical disk. Bottom: Densities inferred from the Type III source positions assuming fundamental (fp; dashed) or harmonic (2fp; solid) emission. Background coronal models based on white-light data (Saito, Poland, and Munro, 1977; Newkirk, 1961) are shown for comparison, along with a recent streamer model based on EUV data (Goryaev et al., 2014).
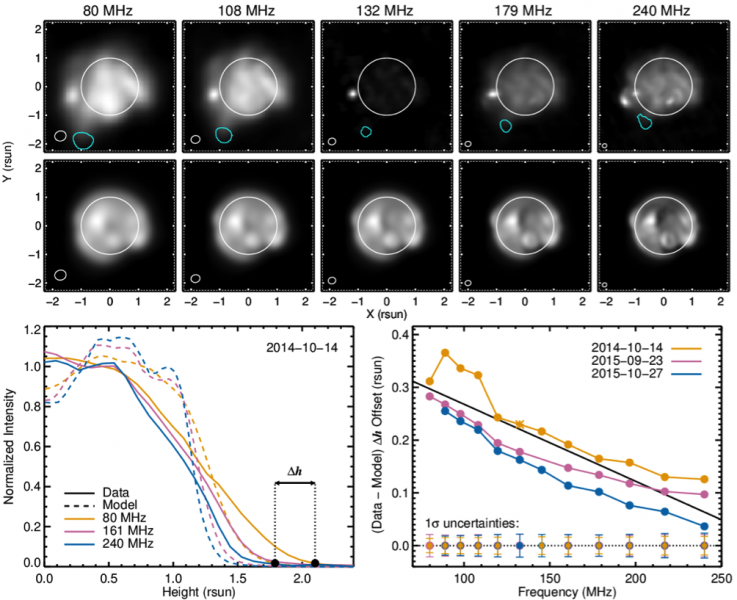
Figure 2 compares the extent of the quiescent corona to synthetic images based on an MHD model. Observations have generally found the corona to be more extended than predicted, and the prevailing explanation for this is also scattering by density inhomogeneities. We used the difference in angular size between the observed and modeled images as a proxy for the extent to which scattering may elevate type III source regions. The lower-right panel of Figure 3 shows the height offsets implied by this comparison. Assuming harmonic emission, these offsets bring the densities to within normal background levels for two events, while one event remains enhanced at a level consistent with a dense streamer.

Figure 2. MWA background images for the 2014-10-14 event (top) and corresponding model images (middle). The cyan curves are the 50% burst contours from Figure 1. Bottom-left: Average normalized intensity versus radial distance obtained from the Figure 9 images. ∆h refers to the height offset between the observed and modeled intensity profiles at the Type III burst height. Bottom-right: ∆h for each event.
Conclusions
We conclude that propagation effects, namely scattering by high density fibers, can partially explain the apparent density enhancements but that beams moving along overdense structures cannot be ruled out. Interestingly, a recent attempt to trace type III electron beams at high frequencies also found large density enhancements (Chen et al. 2013), and the agreement with the low-frequency results in general is striking. Ray tracing simulations that incorporate the corona’s increasingly well-observed fine structure are likely needed to address this further.
Based on recent paper: McCauley, P. I., Cairns, I. H., Morgan, J.: 2018, Sol. Phys., 293, 132
References
Chen, B., Bastian, T. S., White, S. M., et al.: 2013, ApJL, 763, L21
Goryaev, F., Slemzin, V., Vainshtein, L., et al.: 2014, ApJ, 781, 100
Newkirk, G.: 1961, ApJ, 133, 983
Saito, K., Poland, A. I., Munro, R. H.: 1977, Sol. Phys., 55, 121
Wild, J. P., Sheridan, K. V., Neylan, A. A.: 1959, Aus. J. Phys., 12, 369
*Full list of authors: Patrick McCauley, Iver Cairns, and John Morgan
