Type II radio bursts are the result of shocks in the solar atmosphere and they can be observed ranging from sub-metric to kilometric wavelengths (~400 MHz to ~0.4 MHz). Coronal mass ejections initiate most of the metric type II (m-type II) bursts.
The region of a CME responsible for driving the shock might be different for each event and has not yet been comprehensively identified. Multiple scenarios have been suggested, such as a pure bow shock at the CME front and a multiple shock scenario in internal parts, or flanks of the CME, possibly also related to blast waves as triggering events (see e.g. Classen & Aurass 2002). Furthermore, as the shock is triggered by a propagating front travelling faster than the magneto-sonic wave speed, traveling disturbances in the corona can create shocks only in specific structures with low Alfvén speed.
In some cases, the propagating wave can also steepen into a shock while moving towards an environment with decreasing Alfvén speed. The scenario is then additionally complicated as the electron acceleration at shocks resulting in radio emission may be restricted to quasi-perpendicular regions (e.g., Bale et al. 1999).
To date, there is no radio positional observation of type II bursts at frequencies < 80 MHz. The LOw Frequency ARray (LOFAR) operates at frequencies of 10-240 MHz and it features multi-beaming capabilities, which can be used to produce heliographic imaging of the radio source (Morosan et al. 2014). The frequency domain at which LOFAR operates bridges the gap between the metric band and the currently unexplored imaging of the decametric band.
Methods
On 2013 October 26, a type II radio burst was recorded using one of LOFAR’s beam-formed modes. The radio burst was observed with the Low Band Antennas (LBAs) operating at frequencies of 10-90 MHz using six stations at the heart of the core combined to effectively form a single large station, a 320 m diameter island referred to as the Superterp. We used 91 simultaneous beams to cover a field-of-view of 16 R⊙ centred on the Sun. Each beam produces a high time and frequency resolution dynamic spectrum (10 ms; 12.5 kHz) at a unique spatial location which can be used to produce tied-array images of radio bursts.
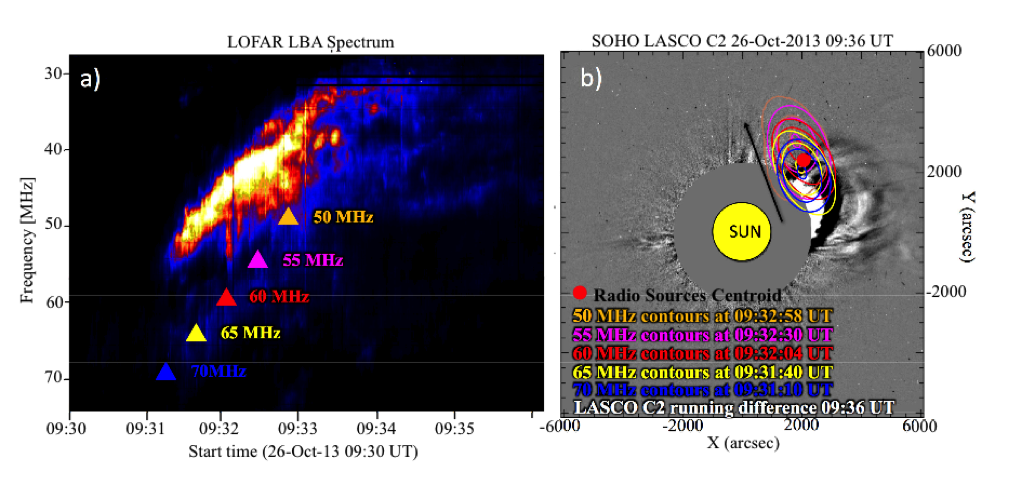 Figure 1. (a) Dynamic spectrum of the type II radio burst observed on 2013 Oct 26, the harmonic emission is visible from 70 to 30 MHz. The specific times and frequencies at which the location of the radio source is calculated are indicated with colour triangles. (b) Running difference image of the CME observed with SOHO /LASCO (09:36-09:24 UT) with superposed contours of the radio sources (80%,90%,95%) using the same colour code of the triangles in panel (a).
Figure 1 shows the spectrum of the type II burst with the superposed triangles indicating the frequency and time at which the locations of the type II burst are reported on Figure 1b. A CME was observed with the LASCO Coronagraph and with COR2 coronagraph on board STEREO-A. Using this multi-viewpoint dataset, the three-dimensional (3-D) surface of the expanding CME can be reconstructed using the method from Rouillard et al. (2016).
Results
The radio emission appears at the flank region where the expansion speed is ~370 km s-1. The flanks of the CME are not the fastest expanding regions of the CME surface. The apex shows a propagation speed of the order of ~500 km s-1. The radio emission however, is located at the flank of the CME indicating that other parameters such as the shock geometry and the Mach number play a key role on the generation of the radio emission from the shock. To estimate the Mach number along the CME expanding surface, we started reconstructing the ambient corona electron density using a combination of SDO /AIA and SOHO /LASCO data as described by Zucca et al. (2014a). Subsequently, we used the Magneto-Hydrodynamic Around a Sphere Polytropic model (MASP; Linker et al. 1999). Once the ambient fast magneto-sonic speed is estimated, the Mach number may be obtained by calculating the ratio between the expanding CME front speed and the fast magneto-sonic speed. Figure 2 shows a 3-D view of the reconstructed expanding CME surface using the technique from Rouillard et al. (2016). The type II radio emission is recorded at the flank of the CME in a region where the speed of the expanding CME reaches ~370 km s-1 and the Mach number ranges from 1.4 to 1.6 and with the orientation of the B -field ~70°.
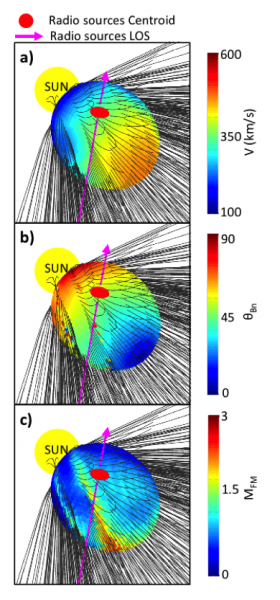 |
Figure 2. 3-D reconstruction of the coronal ambient parameters. Panel (a) shows the CME speed, panel (b) the magnetic field orientation with respect to the perpendicular to the CME front, and panel (c) shows the fast magneto-sonic Mach number. The LOS is indicated with the purple arrow and the radio source centroid is shown with the red circle. The modelled CME front is reported at 09:36. UT in all panels. |
Conclusions
This nugget summarizes a study of a type II radio burst observed on 2013 October 26. We were able for the first time to estimate the spatial location of the type II radio burst at frequencies between (70-50 MHz) using the LOFAR LBA antennas. This study provides observational evidence on the location of the type II emission in the region with quasi-perpendicular geometry and Mach number bigger than 1. This is the region where particles can sufficiently be accelerated to higher energies by shock drift acceleration.
Questions remain on the number of events with shocks at the flank of CMEs, on the necessity of a quasi-perpendicular geometry in type II emission and on the nature of the band-splitting and multi-lane phenomena. Multi-viewpoint observations together with imaging campaigns using LOFAR (interferometric mode using the remote stations) are important to solve the remaining unknowns of the type II radio emission, the related fine structures and the relationship between CME expansion and ambient medium parameters in producing the radio emission.
Based on the recent paper:
Shock location and CME 3D reconstruction of a solar type II radio burst with LOFAR, P. Zucca et al. 2018, A&A.
References
Bale, S. D., Reiner, M. J., Bougeret, J.-L., et al. 1999, Geophys. Res. Lett., 26,1573
Claßen, H. T., & Aurass, H. 2002, A&A, 384, 1098
Linker, J. A., Mikic ́, Z., Biesecker, D. A., et al. 1999, J. Geophys. Res., 104, 9809
Morosan, D. E., Gallagher, P. T., Zucca, P., et al. 2014, A&A, 568, A67
Rouillard, A. P., Plotnikov, I., Pinto, R. F., et al. 2016, ApJ, 833, 45
Stappers, B. W., Hessels, J. W. T., Alexov, A., et al. 2011, A&A, 530, A80
Zucca, P., Carley, E. P., Bloomfield, D. S., & Gallagher, P. T. 2014a, A&A, 564, A47