The 10.7 cm solar radio flux is a widely (if not the most widely) used proxy for solar activity. However, other centimetric wavelengths have also been monitored, some routinely and for several decades. Such observations provide unique records of long-term solar variability. We find that the radio flux at 30 cm receives relatively stronger contributions from Bremsstrahlung vs gyro-resonance emissions (as compared to the 10.7 cm flux); as a consequence, it is a better proxy for solar emissions in the less energetic part of the UV spectrum. This is confirmed by reconstructions of satellite drag by means of DTM (Drag Temperature Model), which performs better when the 10.7 cm flux is replaced by the 30 cm flux.
Daily observations of solar microwave emissions have been routinely made since the 1950’s at the Ottawa/Penticton and Toyakawa/Nobeyama observatories. Given their great value for space weather applications and for understanding long-term solar variability, we have recently set up an operational service that collects these daily values (without flare contributions) at 3.2, 8.0, 10.7, 15.0 and 30.0 cm, and performs quality control, such as replacing missing values. These data are then delivered to satellite operators, and can be accessed at https://spaceweather.cls.fr/services/radioflux/
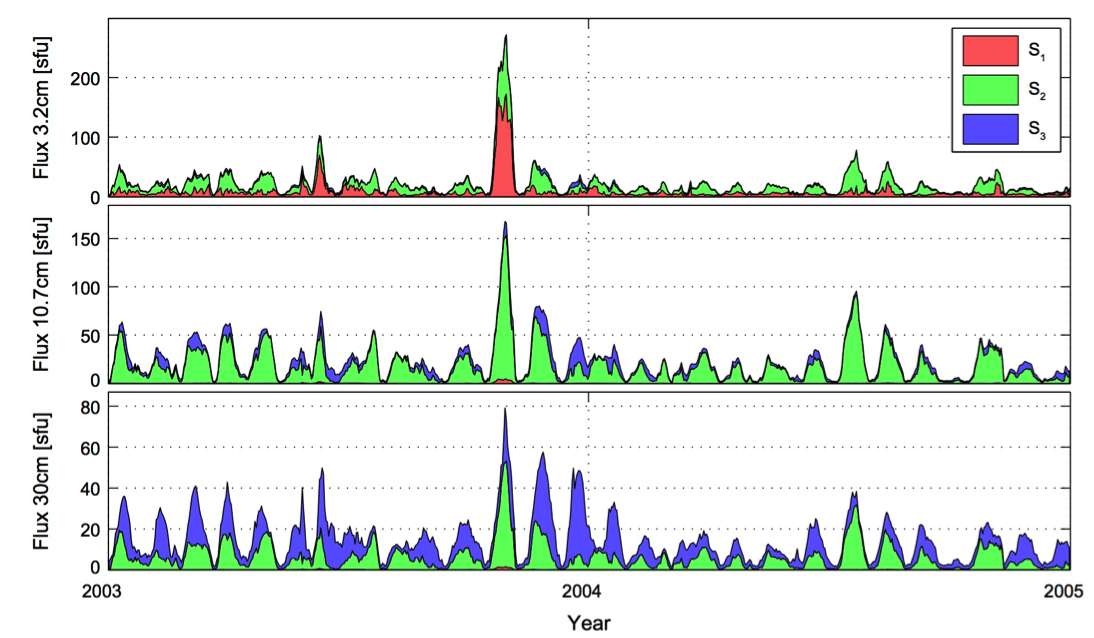
On time scales of months and beyond, these fluxes evolve in a remarkably coherent way. Their short-term variability, however, exhibits subtle differences which carry the signature of the underlying emission processes. In an earlier study [Dudok de Wit et al., 2014] we used a statistical blind source separation approach to reveal the existence of three main contributors to the solar rotational variability. These can be interpreted as 1) thermal Bremsstrahlung, 2) gyro-resonance emissions, and 3) occasional non-thermal emissions. One example is shown in Figure 1, for a period that includes the Halloween event.
Given that this mix of emissions is wavelength-dependent, we can partly emphasize one type of emission process by changing wavelength. In particular, the rotational variability at 30 cm receives a stronger contribution from solar features (faculae, hot coronal loops) whose counterpart in the UV band is relatively brighter in the Far-UV (120-200 nm) than in the Extreme-UV (10-120 nm). These differences are important when it comes to determining the impact on the ionosphere/thermosphere system. We tested this by running the DTM (Drag Temperature Model) for satellite drag with the 30 cm flux instead of the usual 10.7 cm flux. The model bias on the thermospheric density then drops on average by 0–20%. In addition, density variations at the solar rotation period are reproduced with a 35–50% smaller error [Dudok de Wit and Bruinsma, 2017].

Figure 1: rotational variability (S component) at three wavelengths: 3.2 cm (top), 10.7 cm (middle) and 30 cm (bottom). Colours refer to the three main contributions, as determined statistically. The red one (S1) is interpreted as non-thermal gyro-resonance emissions, the green one (S2) as gyro-resonance emissions, and the blue one (S3) as Bremsstrahlung. Figure taken from [Dudok de Wit et al., 2014].
Conclusions
This study highlights the importance of using multi-wavelength observations to
- Help understand the solar sources of microwave emissions (here without flare contributions). By statistical analysis we identify three contributions than can be ascribed to known physical processes, namely Bremsstrahlung and gyro-resonance emissions.
- Develop proxies that are better tailored to space weather products. In particular the radio flux at 30 cm (now called F30 index, by analogy with F10.7) is better suited for the specification of the upper atmosphere because it receives a larger contribution from solar features that radiate relatively more in the long-wavelength part of the UV spectrum.
- Monitor solar variability since the 1950’s. Interestingly, we find that the different contributions to the solar rotational variability have slowly evolved in time. More on this soon.
Additional info
Part of this work was supported by CNES under Contract RTD-0167-CN. We thank the Penticton and Nobeyama radio observatories for making their excellent data available.
Based on the recent paper:
Dudok de Wit, T., & Bruinsma, S. (2017). The 30 cm radio flux as a solar proxy for thermosphere density modelling Journal of Space Weather and Space Climate, 7 DOI: 10.1051/swsc/2017008
References:
Dudok de Wit, T. and Bruinsma, S. (2017), J. Space Weather Space Climate, 7:A9 [online]
Dudok de Wit, T., Bruinsma, S., and Shibasaki, K. (2014), Space Weather Space Climate, 4(26):A06 [online]
