There are many challenges in inferring the spatially and temporally varying temperatures of the dynamic solar chromosphere. The principal problem has been the complex formation of the spectral lines in the UV, visible, and infrared that have been the prime diagnostics to probe this region of the atmosphere. The Atacama Large Millimeter Array (ALMA), which became available for solar observations in 2016, promises to help address this issue by observing the millimeter continuum. At these wavelengths, the emission is formed in the chromosphere and provides a fairly direct measurement of the local electron temperaturеs. Unlike previous millimeter observations [1,2], ALMA is able to provide the required high temporal and spatial resolution to resolve the small-scale chromospheric structures [3].
Observations and Interpretation
We obtained a coordinated dataset combining ALMA maps with imaging spectroscopy of several chromospheric lines in the visible with the Interferometric Bidimensional Spectrometer (IBIS) at the Dunn Solar Telescope on 23 April, 2017. We used a single pointing with ALMA, resulting in an approximately 60 arcsecond-diameter field of view, which fully overlapped with the IBIS 96’’ x 96’’ field. ALMA is an aperture-synthesis interferometer and our observations were obtained with a maximum baseline of 396 m. We observed in Band 3 (2.8-3.3 mm, 92-108 GHz) in the interval 17:19 to 18:53 UT, with ~10 minutes intervals of on-target observations followed by ~2 minutes of phase calibrator observations, repeated six times. The data were also “self-calibrated” to remove remaining spurious phase variations across the various antennas. The absolute brightness temperature was determined using simultaneous full-disk observations and the disk-center calibration derived by [4].
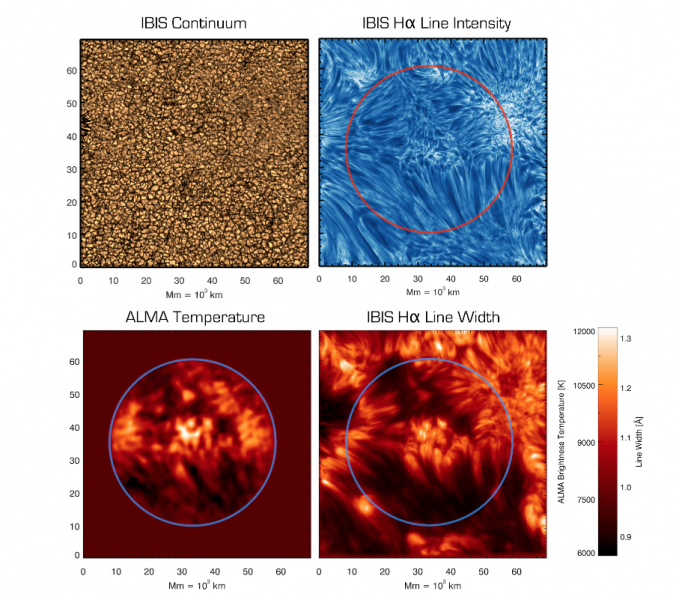 Figure 1 – The top row displays the observed region of the Sun in the visible continuum (left) showing the photospheric granulation, and (right) the intensity in the line core of the H-alpha line tracing magnetic structures in the chromosphere. The bottom row shows the similarity between (left) the spatial map of the brightness temperature measured by ALMA in the 3mm band and (right) the simultaneous measurement of the width of the H-alpha spectral line.
The observed structures at different wavelengths are shown in Figure 1. The appearance of the continuum and H-alpha line core intensity are typical for a strong network region near an active region. What is striking is the resemblance between the ALMA Band 3 brightness temperature and the map of the width of the chromospheric core of the Hα line (bottom panels). This is intriguing, as the source function of ALMA is in LTE, while Hα is a strongly scattering line formed in non-LTE [5]. The good linear correlation between the two quantities (after smearing the IBIS Hα images to match the 2’’ ALMA resolution) can be seen in Figure 2. Previous work had found evidence that the Hα line width was indeed an indicator of chromospheric temperatures [6]. However, the range of temperatures (6000-12000 K) observed with ALMA is too small to explain the varying width of the Hα line as purely thermal Doppler broadening.
We were instead able to reproduce the correlation by synthesizing these two observables from the 1D semiempirical models provided by Fontenla et al. [7] models with the RH code [8]. The results of the synthesis for a range of models are shown as the blue dots on Figure 2. From the synthesis, we are also able to determine the $\tau =1$ heights of the two observables, and we highlight that both formation heights tend to change in concert, moving to greater heights in the hotter models.
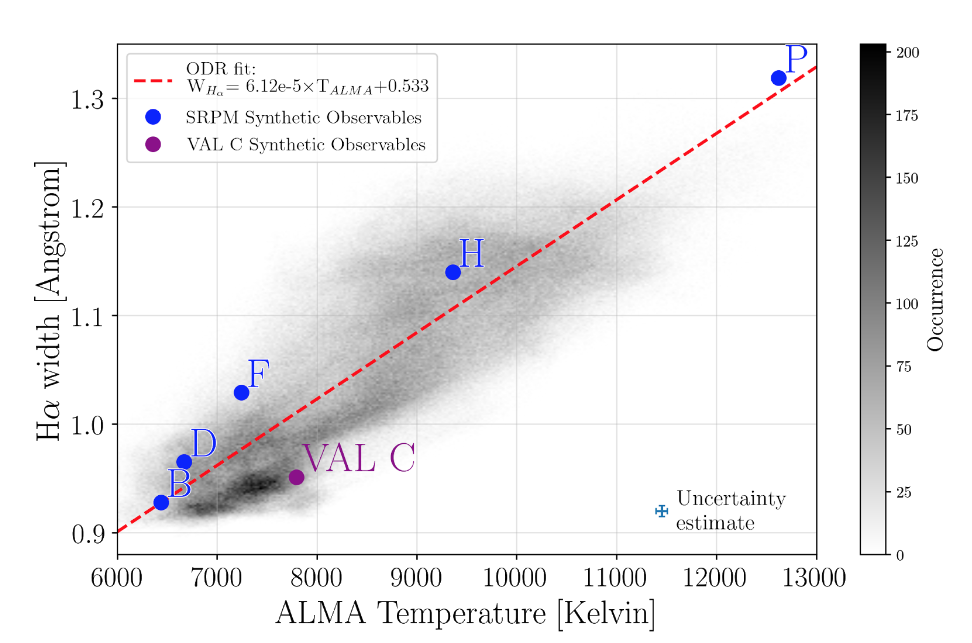 Figure 2 – Scatter plot of the ALMA Band 3 brightness temperature versus Hα line width. The synthetic spectral properties from the Fontenla et al. models (presented as the blue dots) match the observations well.
Based on the outputs from our synthesis, we hypothesize that these two observables are coupled through the hydrogen n=2 level population: the opacity of the millimeter radiation is mostly determined by the electron density. The dominant source of electrons in the mid chromosphere is indeed hydrogen in the n=2 state, which is then ionized through the Balmer continuum from the photosphere. At the same time, the increased population of the n=2 state (the ground state of the Hα transition and source of opacity) increases the line width through opacity broadening (akin to a curve-of-growth effect), justifying the correlation. In hotter model chromospheres, the overall increased population of the n=2 state moves the height of formation of both Hα and the millimeter continuum higher in the chromosphere, closer to the transition region.
Finally, we note that in the models the n=2 state of hydrogen is determined by the Lyman-α wing flux, which should then be strongly correlated with the millimeter radiation.
Conclusions
Overall, our work shows that while the millimeter radiation observed by ALMA may be closely coupled with the local temperature in the chromosphere, the height of formation of that radiation (i.e. where is the “local”) may be highly variable. Much of the spatial variation in observed brightness temperature may not be due to strong horizontal thermal gradients, but rather to a highly corrugated $\tau=1$ surface for the millimeter continuum. The is obviously also the case for the Hα line and its width. However, given the tight correlation displayed by the two observables, this gives us a new way to interpret this old diagnostic.
Based on recently published article “Solar Chromospheric Temperature Diagnostics: A Joint ALMA-Hα Analysis”, The Astrophyiscal Journal, 881:99 (2019) ; Available on ArXiv at https://arxiv.org/abs/1906.08896
References
[1] Loukitcheva, et al., 2014, A & A, 561
[2] White, et al., 2006, A & A, 456
[3] Wedemeyer, S., Bastian, T., Brajˇsa, R., et al. 2016, SSRv, 200, 1
[4] White, S. M., Iwai, K., Phillips, N. M., et al. 2017, SoPh, 292, 88
[5] Leenaarts, J., Carlsson, M., & Rouppe van der Voort, L. 2012, ApJ, 749, 136
[6] Cauzzi, G. et al. 2009, A&A, 503, 577-587
[7] Fontenla, J. M. et al. 2011, JGR, 116, D2080
[8] Uitenbroek, H. 2001, ApJ, 557, 389
*Full list of authors: Kevin Reardon, Momchil Molnar, Yi Chai, Dale Gary