Fibers are short metric/decimetric bursts with a drift rate between type II and type III bursts, usually appearing in groups embedded in type IV continua. In most cases they show both absorption and emission ridges, the absorption having a slightly lower frequency than the emission. They are, most probably, manifestations of whistler-Langmuir wave interaction and they travel upwards along post flare loops (Kuijpers 1975).
In a recent work (Bouratzis et al., 2019) we made an extensive spectroscopic study of fibers observed with the high-cadence (10 ms) acousto-optic analyzer (SAO) of the ARTEMIS/Jean-Louis Steinberg (JLS) radio spectrograph. In this nugget we present results of combined spectral/imaging analysis of fibers observed during the big flare of July 14, 2000 (Alissandrakis, Bouratzis and Hillaris, 2019).
Observations
The ARTEMIS/JLS-SAO dynamic spectrum was analyzed jointly with NRH 2D images at 327, 410.5 and 432 MHz, with a cadence of 125 ms and a resolution of 1′ by 1.5′ at 432 MHz. Images of the flare at 195 Å from TRACE and EIT were also used. Two 45-s intervals, rich in fibers and uncontaminated from other emissions, were selected for further study. The data were subjected to high pass time filtering in order to enhance short structures.
Results
Figure 1 shows that the fibers form two parallel stripes (sources a1-b1 and a2-b2), ~300 Mm long, that are much larger than the 195 Å post-flare loops (c.f. Aurass et al. 2005) and are inclined with respect to them. Source c shows little, if any fiber activity. Practically all fibers visible in the SAO dynamic spectra are detectable in the NRH images. They appear as short-duration enhancements (rms variation ~10%) above the slowly varying type IV background, rather than as discrete sources.
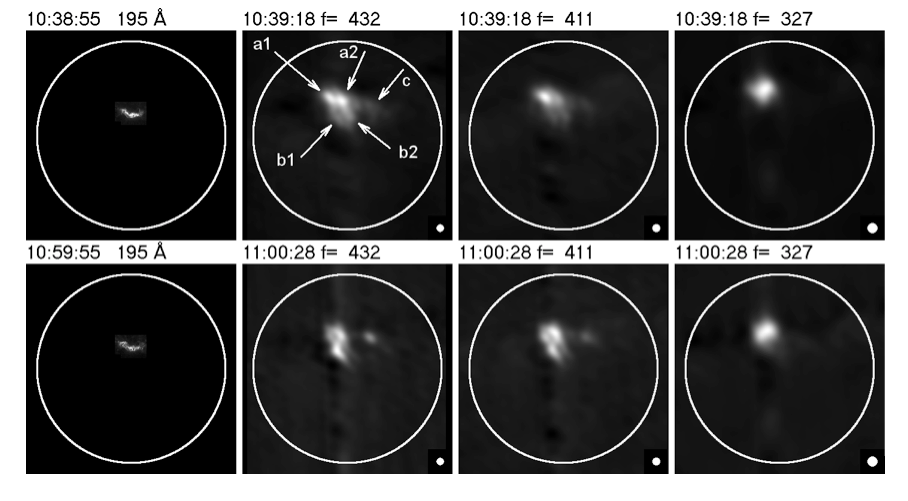
Figure 1 – Average images of the flare and fibers during the two selected time intervals
Figure 2 shows a single image, original and time filtered, during the first interval at all three NRH frequencies and in Stokes I & V. We have a fiber in emission at 432 MHz, background emission at 410.5 MHz and a fiber in absorption at 327 MHz. V images are very similar to I images, with a high degree of polarization (50-80%) in the ordinary sense.
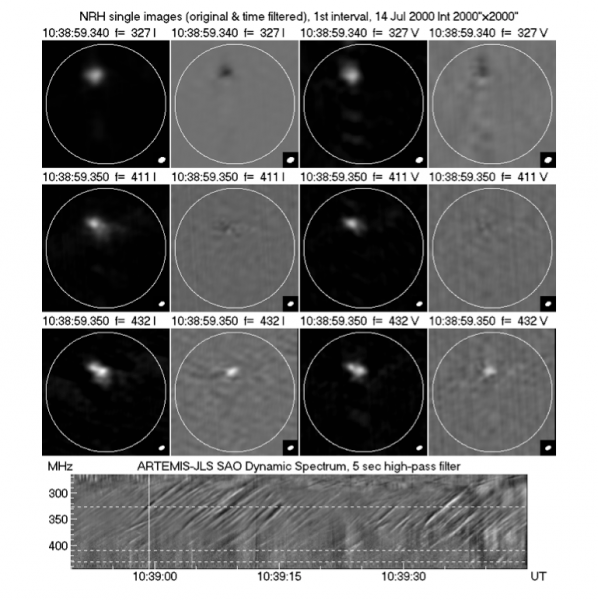
Figure 2 – Single images and dynamic spectrum during the first interval
The single-image sequences in Figure 3 reveal that fibers in emission may coexist with fibers in absorption, thus appearing as a single feature in the dynamic spectrum and giving the impression of supra-luminal motion in 1D images (see Figure 9 in Alissandrakis, Bouratzis and Hillaris, 2019). The time delay between the two frequencies gives drift rates between -8 and -14 MHz/s.
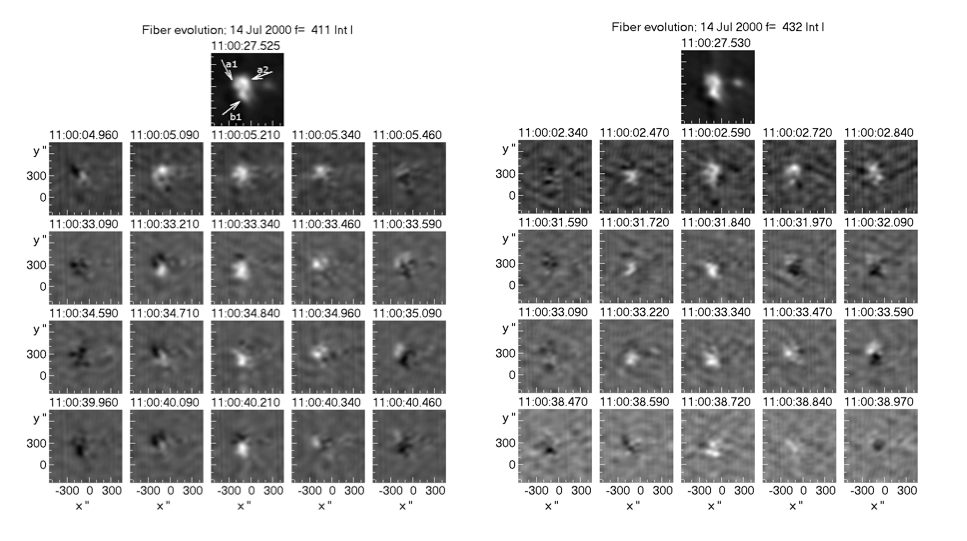
Figure 3 – Sequences of 5 single images ay 411 and 432 MHz during the first interval. The top row shows the average image
Furthermore, from the time delay with respect to 327 MHz and the relative position, we estimated an exciter speed of ~5 Mm/s, in good agreement with the value derived by Bouratzis et al. (2019) from the frequency drift rate. We also estimated the frequency scale length, with spectral and imaging data giving consistent results. Finally, we found that fibers in absorption are very similar to fibers in emission, verifying that they are manifestations of the same wave train.
Conclusions
Summarizing, we found that fibers propagate along loops that are much larger than the EUV post-flare loops, probably portions of large-scale loops encompassing both the CME-associated flux rope and the EUV flare loops. Their location near the east end of the flux rope may explain their large inclination, as the flux rope expands more rapidly in the middle, pushing these loops eastwards. The observed polarization was right-handed, in the sense of the ordinary mode south of the neutral line. We found cases of multiple-fiber emissions appearing at slightly different positions and times; the time differences were comparable to the duration of the emission, and therefore they appear as single fibers in the dynamic spectrum. Combining spectral and imaging information, we obtained consistent drift rates, exciter speeds and frequency scale lengths. Finally, we found that fibers in absorption are very similar to fibers in emission.
Our work showed that the whistler hypothesis works well with both imaging and spectral data. Future work could include nonlinear magnetic field extrapolations, as well as the analysis of a larger sample of events to verify the present conclusions.
Based on the recent paper by Alissandrakis, C.E., Bouratzis, C. & Hillaris, A. 2019, A&A, 637, A133
References
Alissandrakis, C.E., Bouratzis, C. & Hillaris, A. 2019, A&A, 637, A133
Aurass, H., Rausche, G., Mann, G., & Hofmann, A. 2005, A&A, 435, 1137
Bouratzis, C., Hillaris, A., Alissandrakis, C. E., et al. 2019, A&A, 625, A58
Kuijpers, J. 1975, Sol. Phys., 44, 173
* Full list of authors: Costas Alissandrakis, Costas Bouratzis and Alexander Hillaris