Hard X-ray (HXR) and microwave observations of flares show only a few nonthermal sources. They are simple and compact, especially in impulsive flares, suggesting involvement of one to two loops. Hanaoka (1996) and Nishio et al. (1997) interpreted these observations in terms of double-loop flares. This view was later extended up to long-duration flares (Tzatzakis, Nindos, and Alissandrakis, 2008). A concept of a simple flare loop became dominant. However, observations in thermal emissions present complex structures, in agreement with the standard flare model. These observational differences led to different views on flare configurations.
The 26 December 2001 M7.1 long-duration flare sheds light on this issue. SSRT observations at 5.7 GHz (Grechnev and Kochanov, 2016) revealed two gyrosynchrotron sources located above opposite magnetic polarities like conjugate legs of a single loop, but they were not static. We analyze observations of this flare with NoRH at 17 GHz, SSRT at 5.7 GHz, and TRACE in 1600 Angstroms.
Similar Motions of Microwave Sources and Flare Ribbons
NoRH images mostly show two microwave sources. The structure of each source is unresolved. Two flare ribbons appear in UV with intermittent bright kernels indicating footpoints of small loops. Figure 1a presents the centroids of each 17 GHz source (blue) and UV ribbon (red). The background variance image represents all changes during the flare (Grechnev, 2003). The trajectories of the 17 GHz sources and UV ribbons are similar. The magnetic configuration was increasingly asymmetric: the west ribbon entered strongest field above the sunspot umbra, while the east ribbon developed into weaker-field regions (Figure 1b).
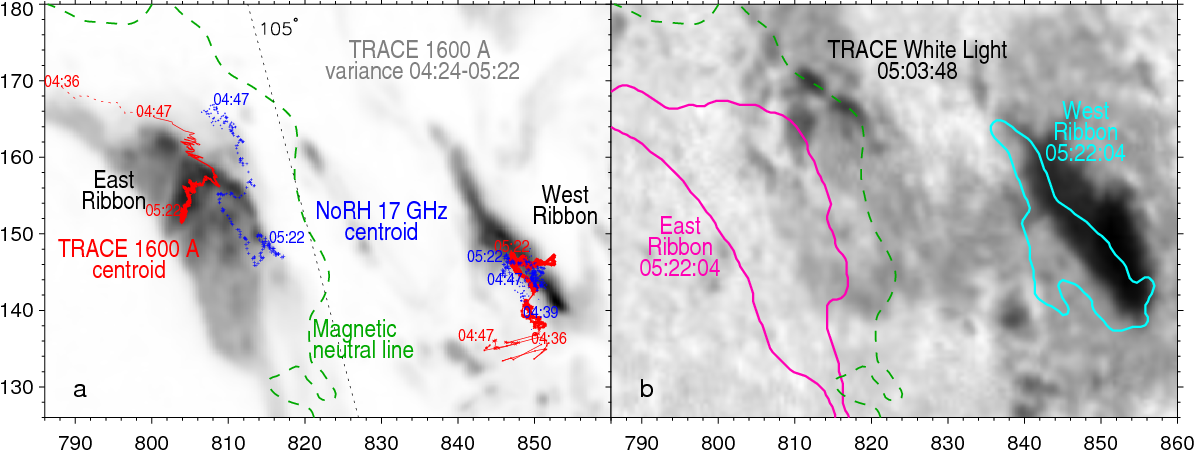
Figure 1. a) Trajectories of the centroids measured for the flare ribbons and microwave sources on top of a 1600 Angstrom variance image (negative) representing the whole flare. The dotted line shows a reference direction in the measurements of the shear angle in Figure 2b. b) White-light image with contours of the ribbons visible in the last 1600 Angstrom image.
Figure 2 compares temporal variations in the distance between the centroids and their “shear” angle with respect to the dotted line in Figure 1a. These relative measurements do not depend on any pointing or coalignment accuracy and confirm the correspondence between the motions of the microwave sources and flare ribbons.
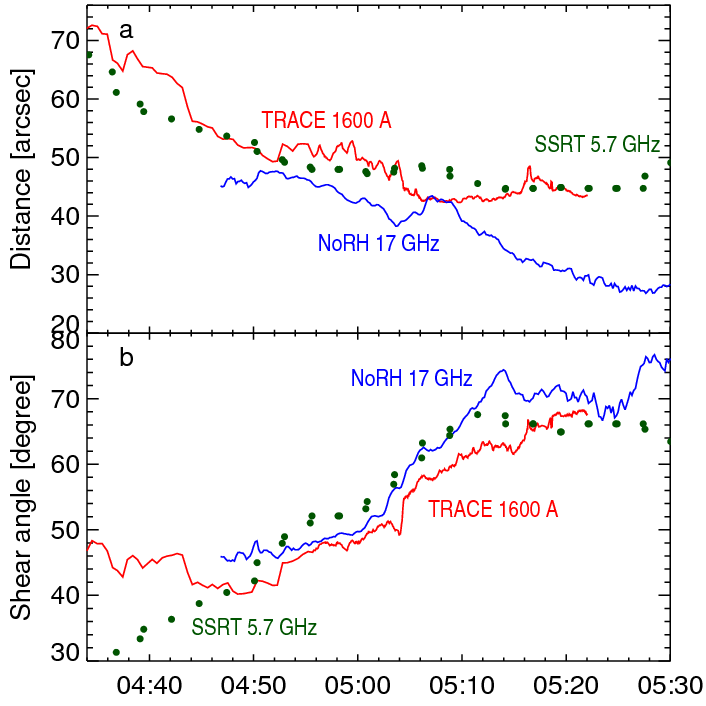
Figure 2. Temporal variations measured for the centroids of microwave sources and those of the flare ribbons: a) distance, b) shear angle.
Expected Appearance of UV Ribbons in NoRH Images and Actual Observations
Thus, physical distinction between the structures emitting in microwaves and UV might be emphasized by different instrumental characteristics of TRACE and NoRH. To verify this idea, we show in Figure 3 TRACE images of different flare episodes convolved with a NoRH beam. Blobs A and B correspond to the two microwave sources and the ribbons. The last microwave image contains a contribution from a coronal arcade invisible in UV. Blob C represents a jet invisible in microwaves. Blob D is a remote part of a ribbon in weak magnetic fields; it should be faint in microwaves. Blobs A and B can only be visible both in microwaves and UV. They look similar in NoRH images and convolved TRACE images and moved similarly during the flare. Most likely, the two microwave sources really correspond to multiple loops rooted in the ribbons rather than a single loop.
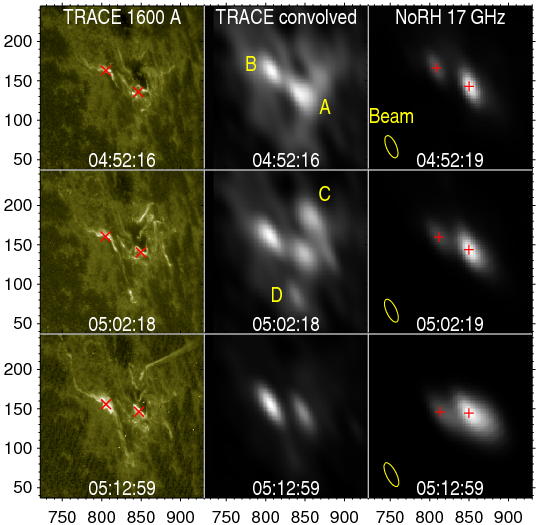
Figure 3. Comparison of TRACE 1600 Angstrom images (left) with NoRH 17 GHz images (right). Middle: the TRACE images convolved with the NoRH beam (ellipses in the right panels). Centroids are denoted by crosses in the left and right columns.
Microwave spectrum
The spatial structure can manifest in the microwave spectrum shown in Figure 4. Atypically, its shape persisted during the flare, while the flux increased by an order of magnitude. A larger total flux with a constant spectrum shape can result from increase in the area of the source with a fixed brightness temperature, but observations show an opposite situation.
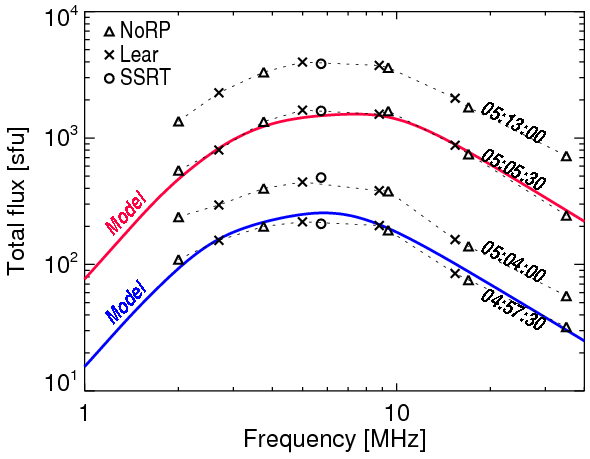
Figure 4. Microwave total-flux spectra at four times from the flare rise to the peak of the burst.
The behavior of the spectrum is explained by an increasing asymmetry of the flare configuration. The magnetic-flux conservation requires larger areas of the sources above the weaker-field east ribbon to balance their conjugate counterparts above the sunspot-associated west ribbon. Based on this fact, we model the spectrum of a distributed multi-loop system containing several pairs of microwave sources in its legs using SOHO/MDI magnetogram. The spectra modeled for two times (color curves) reproduce observations.
Discussion and Conclusion
The source of a seemingly single-loop microwave configuration was a multi-loop arcade rooted in the ribbons. Dissimilarities between the NoRH and TRACE observations of the flare caused by different emission mechanisms were burdened by different characteristics of the instruments.
Masuda, Kosugi, and Hudson (2001) pointed out the limitations on the sensitivity and dynamic range of HXR Fourier-synthesis imagers. Sources weaker than 10 % of the brightest one usually do not appear in HXR images (Krucker et al., 2014). Flares have been imaged in microwaves also mostly with Fourier-synthesis interferometers, whose dynamic range is wider. However, a strong dependence of the gyrosynchrotron emission on the magnetic field makes their opportunities of observing nonthermal structures comparable to HXR imagers, although with a poorer spatial resolution.
Thus, HXR and microwave images reveal only the strongest nonthermal sources implying a single-loop configuration, whereas more than one loop appear to be common in various flares. A proxy of a configuration responsible for nonthermal emissions can be a structure observed in thermal emissions, as well-known models predict.
Based on the recent paper:
Grechnev, V., Uralov, A., Kiselev, V., & Kochanov, A. (2016). The 26 December 2001 Solar Eruptive Event Responsible for GLE63. II. Multi-Loop Structure of Microwave Sources in a Major Long-Duration Flare Solar Physics, 292 (1) DOI: 10.1007/s11207-016-1025-8
*Complete list of authors: V. V. Grechnev1, A. M. Uralov1, V. I. Kiselev1, A. A. Kochanov1
1Institute of Solar-Terrestrial Physics SB RAS, Lermontov St. 126A, Irkutsk 664033, Russia
Additional info
The full work can be accessed here: https://arxiv.org/abs/1611.08349, corresponding author can be reached at grechnev@iszf.irk.ru.
References
Grechnev, V.V. 2003, Sol. Phys., 213, 103.
Grechnev, V.V., Kochanov, A.A. 2016, Sol. Phys., 291, 3705.
Hanaoka, Y. 1996, Sol. Phys., 165, 275.
Krucker et al. 2014, ApJL, 793, L32.
Masuda, S., Kosugi, T., Hudson, H.S. 2001, Sol. Phys., 204, 55.
Nishio, M., Yaji, K., Kosugi, T., Nakajima, H., Sakurai, T. 1997, ApJ, 489, 976.
Tzatzakis, V., Nindos, A., Alissandrakis, C. E. 2008, Sol. Phys., 253, 79.