In the solar corona, shocks are formed when the speed of a disturbance exceeds the local magnetosonic (Alfvén) speed. At low atmospheric heights, above high-density active regions, the Alfvén velocity can drop down to a few hundred km/s, but it then rises steadily to a global maximum of about 1000 km/s near the heliocentric height of 3.5 R (see calculations in Warmuth & Mann 2005). At heights above 1.5 R the Alfvén speed should be at least 500 km/s (Vainio & Khan, 2004). Therefore a shock driver at these heights has to have a speed higher than that.
Radio type II bursts are frequency-drifting bursts visible in the dynamic spectra. They are generally attributed to shock-accelerated electrons that excite plasma waves, that then convert into radio waves. The observed emission at the plasma frequency relates directly to electron density, which reflects the burst driver height under the assumption of a coronal density model.
Metric type II bursts occur in a frequency range that suggest heliocentric driver heights between 1.1 and 2.5 R, and decametric-hectometric type II bursts should originate at heights between 3 and 10 R. Alfvén speed at these heights is relatively high and so a disturbance should have an equally high speed to be able to drive a shock. There has been a long debate on whether the shocks responsible for type II bursts are created by CME bow shocks, shocks in the flanks of CMEs, or by flare (blast) waves. Furthermore, it is not clear if the metric and decametric-hectometric type II bursts have the same origin.
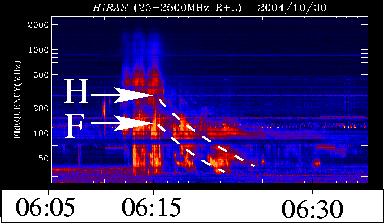
 A metric type II burst observed in the dynamic radio spectrum by HiRAS (Hiraiso Solar Observatory, Japan) on 30 October 2004. Both fundamental (‘F’) and second harmonic (‘H’) emission lanes are visible, indicated by dashed lines.
Slow’ halo-type CMEs
On 30 October 2004, SOHO LASCO observed three flare-related halo-type CMEs. The estimated speeds of the first two were 200-300 km/s, measured from the first observations of the CME fronts located at heights below 5 R. The CMEs are also listed in the LASCO CME CATALOG . Despite the slow initial speeds of the first two CMEs, all three CMEs were associated with metric type II bursts. The first CME, which had the slowest initial speed, was also associated with decametric type II bursts.
Method
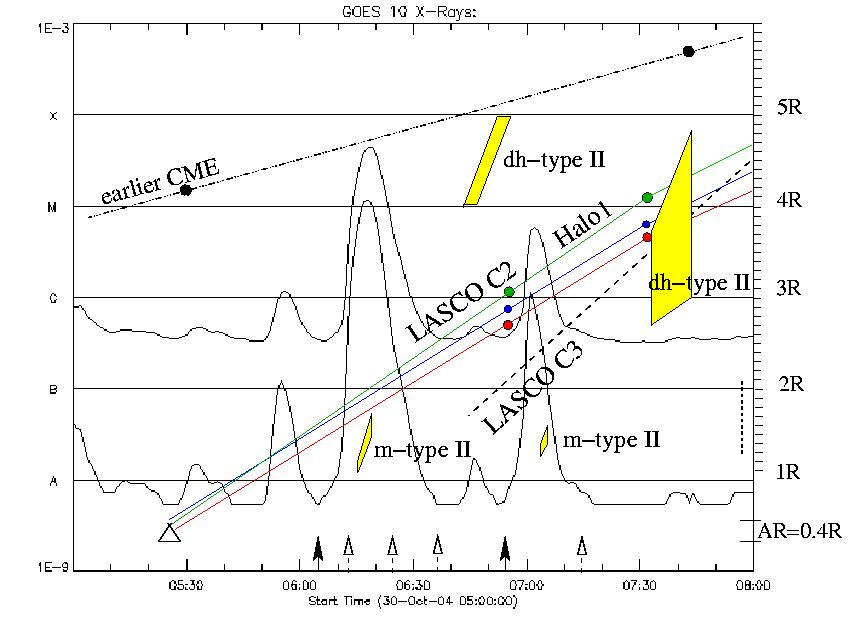
We calculated the type II burst driver heights using different atmospheric density models, to set reasonable limits. A 2-fold Newkirk model was used for densities in the active region corona, and a 2-fold Saito model to get values for the less dense quiet Sun corona. The estimated radio burst source heights associated with the first CME event (‘Halo1’) are shown below, together with the calculated CME heights in white light. The plot also shows the GOES flux curve (flare start times indicated by black-headed arrows) and the times of the observed EUV dimmings (white-headed arrows). As dimmings on the solar surface represent depleted material, they can be a signature of a CME lift-off.

Estimated heliocentric CME heights in solar radii R (along three different radials, LASCO C2 observations) for the Halo1 event, plotted over the GOES X-ray flux curve. Extrapolated linear fit to the height-time data points of the later LASCO C3 observations and those of an earlier CME are also shown. Type II burst times and estimated height ranges are marked in the plot with yellow areas, ‘m-type II’ stands for a burst at metric and ‘dh-type II’ at decametric-hectometric wavelengths (radio observations are from HiRAS, IZMIRAN, and Wind WAVES experiment). Triangle indicates the time of an H-alpha filament eruption (Yunnan). Observations were limited due to bad weather conditions, but there is some indication of another filament eruption around 06:26 UT. Black arrows show the start times of the GOES flares and white-headed arrows show the times when EIT dimmings were observed (note that there were no available EIT images near the start of the second flare, between 06:48 and 07:13 UT). The EIT field of view ends at heliocentric height 1.3 R, and the LASCO C2 field of view begins around 2.1 R, and thus there is a wide range of heights where imaging is not available.
So where and how are the shock-related type II bursts created?
We found that the first two halo-type CMEs started as filament eruptions, but the CMEs were surprisingly slow around 3 R (backwards extrapolation of the CME heights with these speeds actually point to the filament eruption times). The CMEs were associated with flares, and metric type II bursts were observed only during these flares. Although the type II bursts were accompanied by a CME, our detailed study of the CME and type II shock driver heights and speeds casts a doubt on the idea that all metric type II bursts are driven by CMEs. (This claim is basically based on statistics.)
Flare-related CME acceleration could account for the formation of the metric type II bursts. This, however, would require that the CME decelerates heavily soon after, to obtain the observed low speed near 3 R. Looking at the height-time diagram, we see that the metric type II bursts (‘m-type II’ in the plot) are observed soon after the X-ray flare start times and the backwards extrapolation of the burst driver heights gives us the flare start times. Therefore we cannot exclude the possibility of flare blast waves in action. Unfortunately the H-alpha observations could not reveal any propagating shock waves at photospheric level (the observations were affected by changing weather conditions). Furthermore, the first decametric-hectometric type II burst (‘dh-type II’) almost looks like a continuation of the first m-type II, and it also has a much higher height than the simultaneously observed white light CME. The height of the second dh-type II does match with the white light CME, but as the CME undergoes velocity changes after that, the CME acceleration around 4-5 R could also be explained by a fast eruption associated with the later flare.
Read the full paper: ‘Slow halo CMEs with shock signatures’ by Silja Pohjolainen and Niina Lehtinen, in Astronomy and Astrophysics Vol. 449, p. 359-367 (2006), or contact the authors for a reprint.
References:
Newkirk, G. Jr. (1961), ApJ 133, 983
Saito, K. (1970), Ann. Tokyo Astr. Obs. 12, 53
Vainio, R. & Khan J.I. (2004), ApJ 600, 451
Warmuth, A. & Mann, G. (2005), A&A 435, 1123
