The solar radio spikes can provide detailed information about plasma processes in solar flares on kinetic scales. Among them, the decimetric spikes belong to the most interesting ones because they are recorded in some cases close to the starting frequency of Type-III bursts and in relation to hard X-ray emissions.
Stepanov et al. (1999) and Bárta and Karlický (2001) presented models where spike frequencies correspond to those of the upper-hybrid waves, and Willes and Robinson (1996) presented the model with spike frequencies corresponding to the Bernstein modes. Luo et al. (2021) proposed that spikes are generated at the termination shock formed above the flare arcade, where a diffuse supraarcade fan and multitudes of plasma downflows are present. This interpretation is close to the idea that the narrowband dm spikes are generated by superthermal electrons in the magnetohydrodynamic turbulence in the magnetic reconnection outflows (Karlický, Sobotka, and Jiřička,1996).
There is an important additional aspect of the narrowband dm spikes that is not frequently considered in theoretical models. Namely, spikes appear in frequency bands and the ratio of band frequencies is noninteger (1.06 – 1.54) (Krucker and Benz 1994). In the paper by Karlický, Benáček, and Rybák (2021), this result was not only confirmed, but very narrow bands of spikes in the 7 November 2013 event enabled a successful fit of the band frequencies by the Bernstein modes.
Observations
We investigated spike events observed during the 13 June 2012 flare by 800-2000 MHz Ondřejov radiospectrograph with a time resolution 0.01 s and frequency resolution 4.7 MHz. Moreover, we analyzed the relation between the radio and AIA/SDO UV, HMI/SDO, and RHESSI X-ray.
The radiospectrogram is shown in Figure 1, and the numbered spike events are classified in Table 1 into three categories according to their appearance in the radio spectrum: spikes distributed in a broad band or bands (SB), spikes distributed in zebra-like bands (SZ), and spikes distributed in broad and narrow bands (SBN). Characteristic ratios of neighboring spikes are determined if more than one band appears. Examples of spike types are shown in Figure 2.
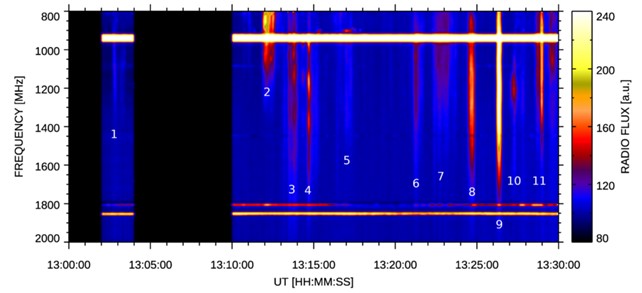
Figure 1. The radio spectrum observed at 13:10:00 – 13:30:00 UT during the 13 June 2012 flare by the Ondřejov radiospectrograph.
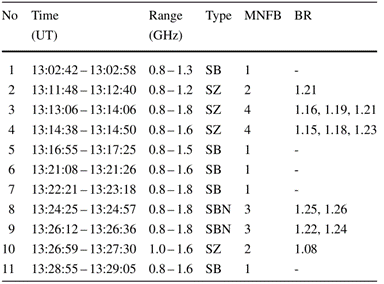
Table 1. Basic parameters of groups of spikes during the flare in Figure 1: Times, frequency range, types, maximal number of frequency bands (MNFB), and characteristic ratios of neighboring bands of spikes (BR).
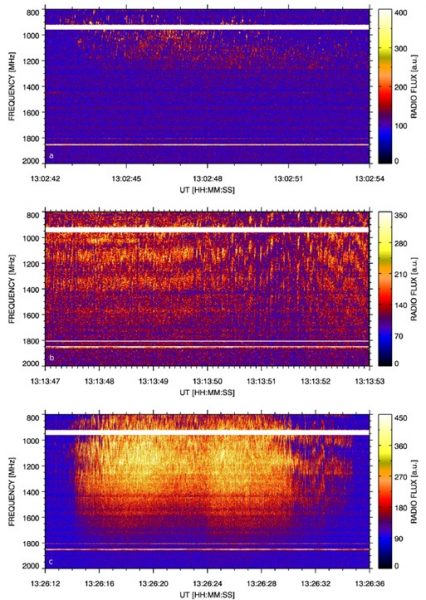
Figure 2. Spikes observed during the 13 June 2012 flare. The radio spectrum shows spikes distributed in a) broad band or bands (SB), b) zebra-like bands (SZ), and c) in broad and narrow bands (SBN).
Conclusions
We confirm that the dm spikes are observed mostly during the impulsive flare phase. We tried to search for some relation between spikes groups and variations of intensities in selected flare locations using AIA/SDO observations. We found interesting relation for AIA intensities taken from one end of the sigmoidal flare structure where many magnetic-field lines of flare loops were concentrated.
We found that similar autocorrelations of SZ and SBN favor the same generation mechanism of these spikes. Because of its similarity to Karlický et al. (2021), we interpret SZ and SBN as generated in Bernstein modes. We supported this interpretation by simulations of Bernstein modes.
We compared the SZ type and a zebra observed on 1 August 2010 in the same frequency range. We found a few differences:
- Separation frequency is about 220 MHz in the SZ case, while around 24 MHz in zebras,
- The autocorrelation variability in time is significantly higher for zebras than for SZ type,
- The ratios between SZ spike bands is (4.4, 5.1, 6.0, 7.0) and (4.0,4.9, 6.0), while for zebras is ~52,
- The separation frequency of neighboring zebra stripes changes in different ways for different pairs. This behavior excludes the possibility that zebras are generated in one emission source, as are the SZ type spikes by Bernstein modes.
In accordance with our previous ideas (Bárta and Karlický, 2001), we conclude that the SZ and SBN are formed in in a region of magnetic reconnection outflow, where the plasma is in a turbulent state. Using the Bernstein model, we estimated the mean magnetic-field strength and plasma density in the SZ source as about 79 G and $8.4\times 10^9$ cm$^{−3}$, respectively.
Based on recent paper by Karlicky et al., ‘Narrowband spikes observed during the 13 June 2012 flare in the 800-2000 MHz range‘, Solar Physics 297:54 (2022), DOI: https://doi.org/10.1007/s11207-022-01989-4
References
Bárta, M. and Karlický, M. 2001, A&A, 379, p. 1045–1051.
Karlický, M., Sobotka, M., and Jiřička, K. 1996, Sol. Phys., 168, 2.
Karlický, M., Benáček, J., and Rybák, J., 2021, ApJ, 910, 2.
Krucker, S. and Benz, A. O., 1994, A&A, 285, p. 1038–1046.
Luo, Y., Chen, B., Yu, S., Bastian, et al. 2021, ApJ, 911, 1.
Stepanov, A. V., Kliem, B., Krüger, A., et al. 1999, ApJ, 524, 2.
Willes, A. J. and Robinson, P. A. 1996, ApJ, 467, 465.