Filaments (or prominences) are “clouds” of cool (<104 K) material suspended in the solar corona by up to tens of megameters above the photosphere, and they can be broadly divided into quiescent filaments and active region (AR) filaments. Although both of these structures have been observed for a long time, particularly in recent years by NASA’s IRIS telescope, there are open questions on the magnetic topology of filaments and the formation of their dark threads (e.g., Chen et al. 2020).
ALMA observations at different millimeter (mm) wavelengths can be used to scan through different layers of those structures, providing temperature diagnostics for filament fine threads (e.g., Heinzel et al. 2015; Gunár et al., 2016; Rodger & Labrosse 2017) as discussed in a previous CESRA nugget. Recently, the first ALMA observations of a large (quiescent) prominence at the solar limb have been reported (Heinzel et al., 2022; Labrosse et al., 2022). AR filaments had not yet been observed at mm wavelengths because their comparatively small spatial scales (few arcseconds) could not be resolved. In da Silva Santos et al. 2022, we present brightness temperature maps of an AR filament taken with Band 6 (1.25 mm or 240 GHz) at 0.6 arcsec spatial resolution. We compared the ALMA data with cotemporal Mg II spectra taken by IRIS and context UV imaging provided by SDO/AIA.
ALMA and IRIS capture the dramatic time evolution of an AR filament
We find dark/cool elongated features in the ALMA Band 6 (1.25 mm) maps with brightness temperature values typically within ~4000-5000 K, but they can be as low as ~3000 K in some instances, thus significantly below the local background level (~6000 K). Those structures partly coincide with the filament body seen in the AIA 304 Å channel and the red and blue peaks of the Mg II resonance lines probed by IRIS. However, there are significant brightness variations across the filament spine and in time (Fig. 1).
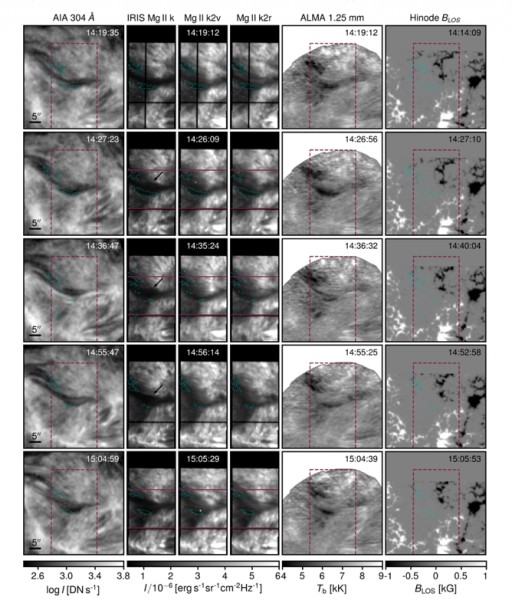
Figure 1. Time evolution of an AR filament observed by SDO/AIA, IRIS, and ALMA Band 6 in April 2019 near the disk center. The intensities are capped for display purposes. Hinode/SOT line of sight magnetograms are shown for context. The dashed rectangles show the area covered by the IRIS raster scan. The cyan contours show Tb (1.25 mm) = 5,000 K. (da Silva Santos et al. 2022)
Clustering analysis shows that brightness temperature values lower than 5000 K at 1.25 mm coincide with regions of low integrated intensity in the Mg II h and k lines where the lines are weak, the central reversals are shallow, and the peak asymmetry and Doppler shifts are small. Together, these multi-wavelength observations can be used to set constraints on the filament temperature, density, and velocity gradients.
ALMA temperatures in different bands are not consistent with isothermal conditions
ALMA Band 3 maps obtained after the Band 6 observations on the same day do not show the same high-contrast dark threads still visible in the AIA 304 passband at that time (Fig. 2). The lower spatial resolution of Band 3 relative to Band 6 (by a factor of ~2) partly explains the lower contrast, but the filament threads with typical sizes of a few arcseconds should be resolved in the Band 3 maps. This is interesting in that the contrast was expected to increase at lower frequencies, as shown by previous low-resolution (>20 arcsec) observations of quiescent filaments.
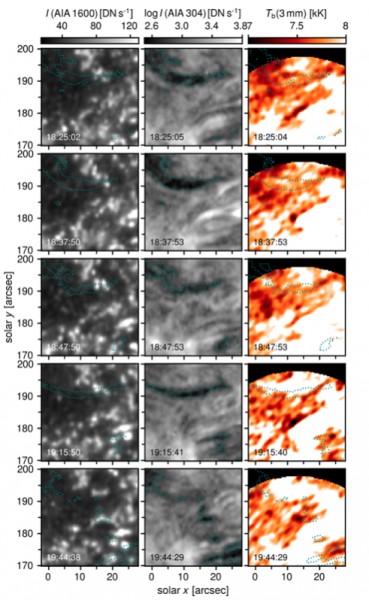
Figure 2. ALMA Band 3 (3 mm) observations at a later time on the day do not show the filament structure. The Band 3 temperatures are capped at 8,000 K to enhance Tb variations within the filament. The cyan contours show the filament in the AIA 304 Å images. (da Silva Santos et al. 2022)
The kinetic temperature and optical thickness of the filament cannot be simultaneously inferred from single-band ALMA observations, but it requires imaging at different mm wavelengths and the commonly employed assumption of isothermal conditions (e.g. Heinzel et al. 2015). Assuming that the average properties of the filament did not significantly change between the time the data were taken in both bands, the observed mean brightness temperatures at 1.25 mm and 3 mm are not compatible with an isothermal model but suggest that Band 6 likely probes the coolest filament threads, whereas Band 3 senses warmer filament plasma or possibly the outermost shell that separates it from the corona if the optical thickness is large. Simultaneous observations in both bands would be needed to further investigate these findings; however, this is not currently possible due to instrumental overheads.
Conclusions
ALMA continuum observations can be used to measure temporal variations in temperature in filament fine-scale structures. In the absence of suitable models in the literature to which our data can be compared, our results underline the need for follow-up radiative transfer modeling of the mm continuum and the Mg resonance lines to constrain the thermodynamics of AR filaments.
*Based on the recent article: da Silva Santos, J. M., White, S. M., Reardon, K., Cauzzi, G., Stanislav, G., Heinzel, P. & Leenaarts, J., Subarcsecond imaging of a solar active region filament with ALMA and IRIS, 2022, Front. Astron. Space Sci. 9:898115. doi: 10.3389/fspas.2022.898115
References
Chen, P., Xu, A., & Ding, M., 2020, Res. Astron. Astrophys, 20, 166
Gunár et al., 2016, Astrophys. J., 833, 141
Heinzel at al., 2015, Sol. Phys., 290, 1981
Heinzel et al., 2022, Astrophys. J. Lett., 927, L29
Labrosse et al. 2022, MNRAS Lett., slac021
Rodger, A.S., Labrosse, N.: 2017, Sol. Phys., 292, 130