Metrewave solar type-III radio bursts offer a unique means to study the properties of turbulence across coronal heights. Theoretical models have shown that the apparent intensity and size of the burst sources evolve at sub-second scales due to turbulent scattering of radio waves close to their generation sites (Arzner & Magun, 1999; Kontar et al., 2019). The advent of high cadence snapshot spectroscopic imaging capabilities in meter wavebands have made observations of turbulence-related effects feasible across a range of coronal heights. By comparing observations with existing models, it is now possible to study the spatio-temporal scales and strength of density fluctuations ($\delta$N/N) across corona. This study presents the nature of turbulence across a height range of ~1.54 – 1.75 R$_\odot$ explored by 80 – 200 MHz band. This extends the earlier results which were primarily within 30 – 80 MHz ( $\gtrsim$ 1.9 R$_\odot$).
Event & Analysis
This study was done using archival type-III observations from the Murchison Widefield Array (MWA). The events that satisfied the following criteria were chosen: source is close to the disk centre; has a single pulse structure in time across the whole 80 – 240 MHz band; there are no strong pre-existing nearby sources. The disk-centre criterion ensured that the open field lines along which the burst triggering supra-thermal electrons travelled are alone the line of sight. So the observed turbulent source scattering effects in the image plane primarily depend only the plane perpendicular to open magnetic field structures. This makes isotropic scattering framework applicable to a good extent. The condition of single pulse structure made sure that the event is associated with a dominant single episode of particle acceleration and hence the observed spectral flux evolution can be interpreted as a response to a single event. Only an observation matched all criteria.
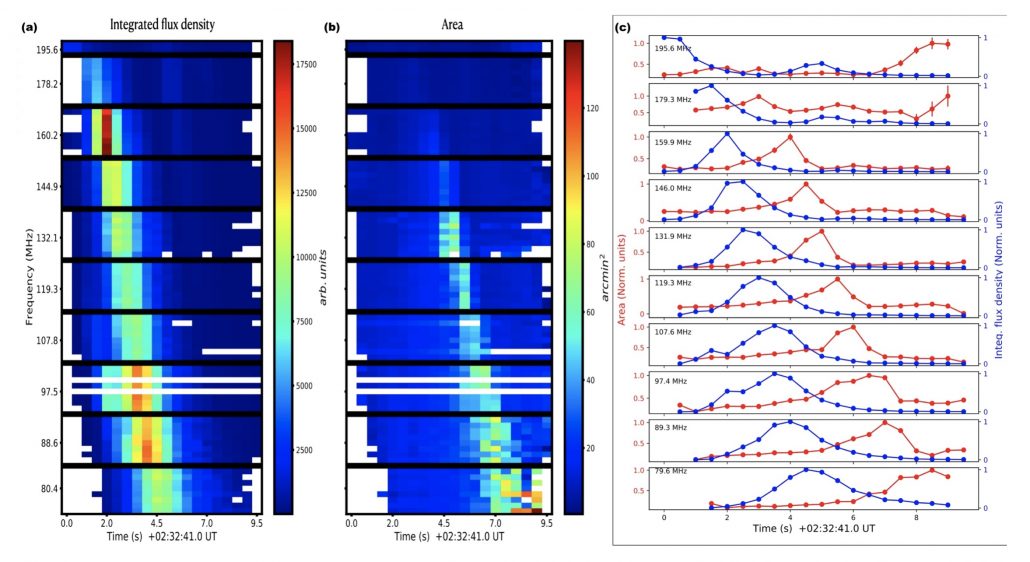 Figure 1. (a-b) – Integrated flux density and area evolution of the Gaussian burst source. Thick black lines separate the MWA 2 MHz bands.(c): Normalised light curves at mid-band frequencies.
Imaging of this dataset was done at 0.5 s and 160 kHz resolution using AIRCARS pipeline. 2D Gaussian fits were performed on the burst images and the evolution of integrated flux and standard deviation along the major and minor axes ($\sigma_{major(minor)}$) were estimated. The evolution of source area was obtained as $\pi \sigma_{major} \sigma_{minor}$, across the observation band. Figure 1 a&b shows the evolution of area and integrated flux of the source in normalised units. Note that the MWA observations were in 12 separate 2 MHz bands centred around the frequencies of the light curves in the Fig. 1c.
Results
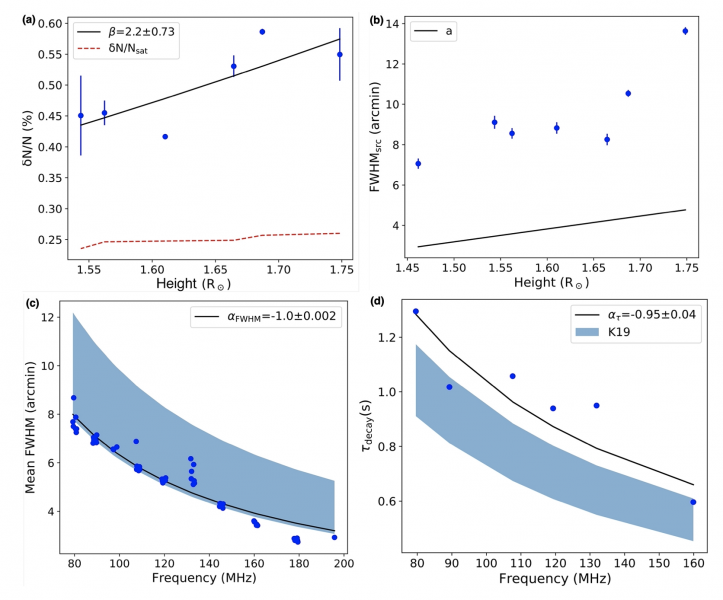 Figure 2.(a) – $\delta$N/N and the theoretical situation scale across height (dotted). (b): Intrinsic source sizes and the typical open flux tube sizes across height. (c-d): Mean source sizes and decay times across frequency with best-fit power law models (black). Shaded regions mark the empirical models by Kontar, E.P. et al., 2019.
The observed burst source area rise in tandem with its intensity evolution is consistent with the model of radiowave propagation under a turbulence isotropic in the image plane. The observations suggest that the effect of turbulence is primarily restricted to a narrow effective screen of width L ~ 0.25 R$_\odot$. The $\delta$N/N estimates are found to be lager than the theoretical saturation scale ($\delta$N/N$_{sat}$) implying a diffusive regime of radiowave propagation. The $\delta$N/N increased with coronal height following a power law function with an index of 2.2$\pm$0.7. Deconvolving the effect of scattering, the true source sizes could be estimated (Fig. 2 b) which were compared against the empirical model for closed coronal loop sizes by Aschwanden, M, 2003. The observed sizes agreed with the empirical model within an order of magnitude but were systematically higher. This could be because the open flux tubes are generally wider than the closed ones. The observed mean FWHM of the Gaussian source and its intensity pulse decay time are studied as a function of observation frequency (Fig. 2 c&d). Comparing these with the empirical trends derived by Kontar, E.P. et al., 2019 using primarily low frequency data showed an interesting match with similar power law dependancies.
Conclusions
This work extends the results on coronal turbulence in 30 – 80 MHz range up to 200 MHz using data from MWA. The strength of density fluctuations ($\delta$N/N) increases with height as a power-law with an index of ~ 2.2$\pm$0.7. However, combined with earlier results, the values of $\delta$N/N varies only within a few factors across ~ 1.5 – 2.2 R$_\odot$. The sizes and the decay time of the burst source roughly follow the empirical model derived for low frequency data. The intrinsic sizes of the burst source were derived, correcting for scatter broadening. The results are consistent with the expectations from an open coronal flux tube.
Based onrecent paper: Atul Mohan, 2021, A&A, 655, 77
References
Coles, W. A. & Harmon, J. K. 1989, ApJ, 337, 1023
Arzner, K. & Magun, A., 1999, A&A, 351, 1165
Wohlmuth, R., Plettemeier, D., Edenhofer, P., et al. 2001, Space Sci. Rev., 97, 9
Aschwanden, M. J. 2003, ArXiv e-prints, arXiv:astro-ph/0309505
Kontar, E. P., Chen, X., Chrysaphi, N., et al., 2019, ApJ, 884, 122