The imaging and spectroscopy observations of solar radio bursts can provide information on the non-thermal electrons associated with the transient energy release in the solar active region and the parameters of the background plasma. However, the corona plasma is an inhomogeneous refractive media for solar radio waves. Propagation effects, namely the refraction and scattering of waves, can cause the deformation of the observed radio source, including the expansion of the source size, and the offset of the visual source position from the “real source” at the wave generation site.
Ray-tracing simulation is an effective method to investigate the wave propagation effects, which can help us in interpreting the imaging and spectroscopy observation and in diagnosing the solar corona properties from the observation results (Steinberg et al.1971; Arzner & Magun,1999; Kuznetsov et al., 2020). Figure 1 shows an example of simulation results of a point pulse source generated at the limb with highly anisotropic fluctuation of the background plasma density, on the basis of the anisotropic radio-wave scattering model developed by Kontar et al. (2019). With this method we can obtain the source size, position, duration and visual speed.
 Figure 1 – [GIFmovie] Temporal variations of the 2D-flux distribution of the apparent source in the sky plane (upper panel) and the total flux (lower panel) in a simulation with a point pulse source for fundamental emission at 35 MHz. The starting position angle of the source is 45 Degree. The parameter set is $\epsilon=0.27$ and $\alpha=0.104$.
In this work, we perform ray-tracing simulations on radio wave transport in the corona and interplanetary region, and compare the simulation results with previous observations to estimate the property of the background plasma. For the first time, the variation of the apparent source size, burst duration, and source position for the fundamental emission and harmonic emission at the frequency of 35 MHz are simulated as a function of the anisotropic parameter α and the angular scattering rate coefficient $\eta=\frac{\epsilon^2}{h_0}$ , where $\epsilon = \frac{\langle \delta n^2 \rangle}{n^2}$ is the density fluctuation level and $h_0$ is its correlation length near the wave excitation site.
Simulation Results
1. Source Size and Duration
The source size and duration are the most common information that can be extracted from imaging and spectroscopy observations of solar radio bursts. Figure 2 shows the source size and decay time of the simulation results for the fundamental emission. The simulation results in the parameter space can be used to constrain the background plasma properties near the wave generation site. By comparing the observed duration and source size with the simulation results, we can estimate the scattering coefficient and the anisotropic parameter η=8.9×10⁻⁵ km−1 and α=0.719 with a point pulse source assumption.
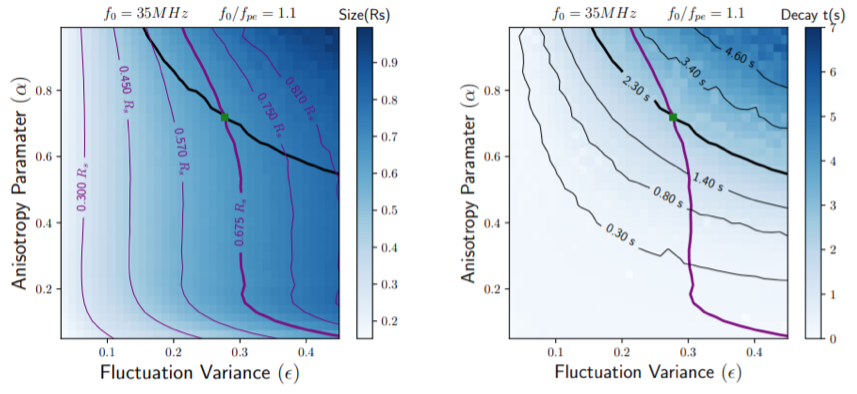
Figure 2 – The source size and decay time of the simulation results for the fundamental emission. Purple lines in the left panel show the contour of source size, and black lines in the right panel show the contour of the decay time for the simulation data. The green square marks the cross point of the bold contour lines at $\epsilon= 0.277$ and $\alpha= 0.719$. The equivalent scale length of density fluctuation $h_0$ is about 860 km near the wave generation site.
2. Offset of Source Position
Figure 3 shows the offset of the reconstructed source centroid from the starting point. We can see that for the same frequency, the source of fundamental emission is more outward shifted than that of the harmonic emission. This may produce the co-spatial positions of the fundamental and harmonic waves in the observation of some type III radio bursts.
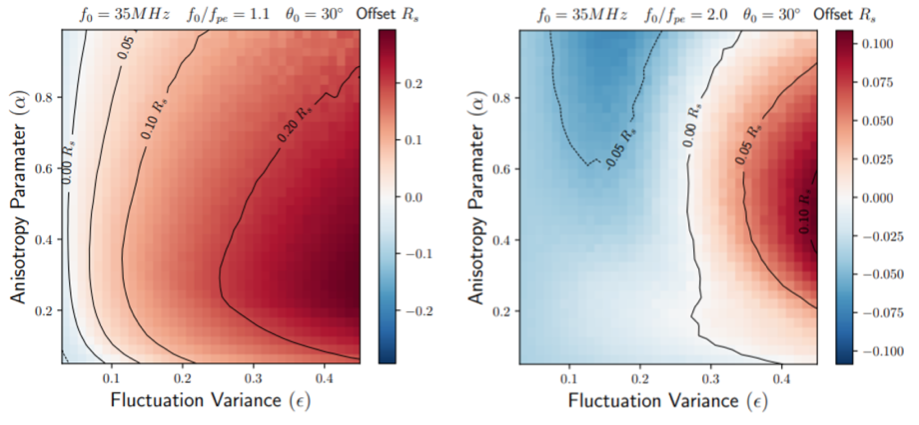
Figure 3 – The offset of the reconstructed source centroid from the starting point of the fundamental emission (left panel) and the harmonic emission (right panel). The equivalent scale length of density fluctuation $h_0$ near the wave generation site are about 860 km and 1010 km for the fundamental emission and the harmonic emission respectively.
3. Visual speed of the source
The propagation effects can also be (partially) responsible for the high speed motion of the observed source in the sky plane at a given frequency (Zhang et al, 2020). One can see from Figure 4 that the maximum visual speed is about 0.65 R$_{\odot}$ s$^{-1}$ or 1.5 c with largely anisotropic fluctuation of the background density.
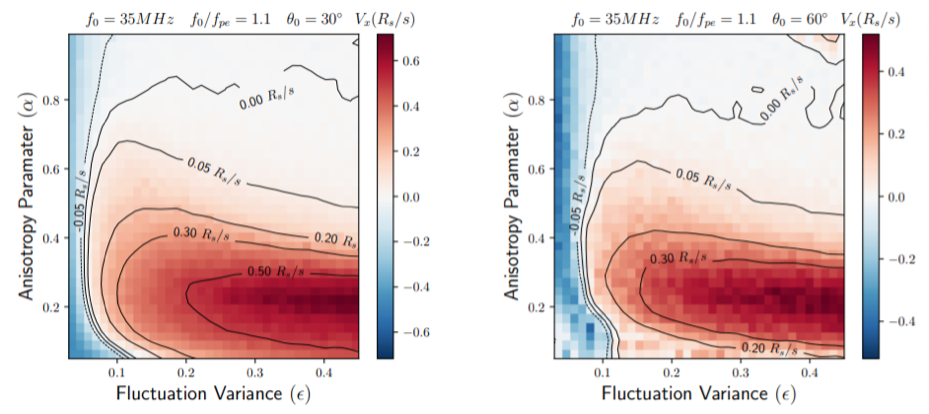
Figure 4 – The visual speed of the source for the fundamental emission. The positive value represents the outward motion from the solar disk center, while the negative value represents the inward motion in this figure.
Conclusion
1. For the fundamental emission, both the source size and decay time increase with the scattering rate coefficient or the variance of density fluctuation. The isotropic fluctuation can produce a larger decay time than a highly anisotropic fluctuation, while the source size is not sensitive to the level of anisotropy for α > 0.2. For the harmonic emission, both the source size and decay time are largely determined by the variance of the density. The decay time of the harmonic emission is significantly smaller than that of the fundamental emission for the same background parameters.
2. By comparing the source size and decay time derived from simulation results to the observational statistics, we obtained the estimation of $\eta=8.9\times 10^{-5}\,km^{-1}$ and $\alpha=0.719$ near the source region of the fundamental emission at the frequency of 35 MHz.
3. The statistical results of the offset show that the source of the fundamental emission is more outward shifted than that of the harmonic emission by the propagation effect, which could account for the co-spatial positions of the fundamental and harmonic emission in some observations.
4. The observed source position and size can have significant visual motion and expansion due to the wave propagation effects. Both the visual speed and the expansion rate tend to be large for highly anisotropic medium. For the fundamental emission, the visual speed of the source size can reach about 1.5c at $\eta=8.9\times 10^{-5}\,km^{-1}$ and $\alpha=0.2$.
Based on recent paper: Zhang P.J., Wang C.B., Kontar E.P. 2021, ApJ., 909, 195
References
Arzner K., & Magun A., 1999, A&A, 351, 1165
Kontar E. P., Chen X., Chrysaphi N., et al.. 2019, ApJ, 884(2): 122.
Kuznetsov A. A., Chrysaphi N., Kontar E. P., & Motorina G., 2020, ApJ, 898, 94.
Steinberg J., Aubier-Giraud M., Leblanc Y., & Boischot A., 1971, A&A, 10, 362.
Zhang P., Zucca P., Sridhar S. S., et al., 2020, A&A, 639, A115
*Full list of authors: PeiJing Zhang, ChuanBing Wang, Eduard P. Kontar