Coronal Mass Ejections (CMEs) expelled from the Sun can drive shocks that accelerate electrons which, in turn, produce electrostatic oscillations called Langmuir waves. These waves are then converted into escaping e.m. radiation, known as type II solar radio bursts, emitted near the fundamental and/or harmonic of the local electron plasma frequency. As shocks propagate outward from the Sun to regions of lower plasma density, type IIs appear in dynamic spectra as a pair of narrow, slowly drifting lanes with a frequency ratio of 1:2. Each lane is often further split into sub-bands. The origin of band-splitting in type II radio bursts is still controversial. One possible explanation is that the two bands originate from simultaneous emission occurring in the upstream and downstream regions of the shock (Smerd et al. 1975). Under this hypothesis, the upstream magnetic field strength B can be estimated by inferring the density jump at the shock front from the instantaneous band split. Band-splitting can also be generated by emission from sections of the shock front expanding through structures with different density and magnetic field distributions. In fact, type II bursts likely originate at the intersection of the shock with enhanced density (and thus low-Alfvén speed) regions of the corona, such as coronal streamers (Mancuso & Raymond 2004). The key result of this work is that, under this latter assumption, it is still possible to reliably infer the magnetic field strength B and its profile in the inner corona when favorable conditions are met, even without the use of stereoscopic observations.
Observations and modeling
The type II analyzed in this work was associated with a CME-driven shock occurred on 2014 October 30 over the southeast limb of the Sun. The CME dynamics was inferred from EUV observations obtained with SDO/AIA. The CME-driven shock was modeled as a spherical expanding/translating surface. Its radius of curvature was determined through a least-square fitting procedure to identify the best match between the 3D model and the observational constraints given by the spatiotemporal evolution of the type II sources whose positions were imaged in a wide frequency range by the Nançay Radioheliograph (NRH) (see Figure 1). The type II emission was assumed to originate at the intersection of the shock surface with two adjacent low-Alfvén speed coronal streamer structures. In this way, we were able to infer both the time-evolving 3D geometry of the CME/shock and the spatial location of the axes of the two streamers (see Figure 2).
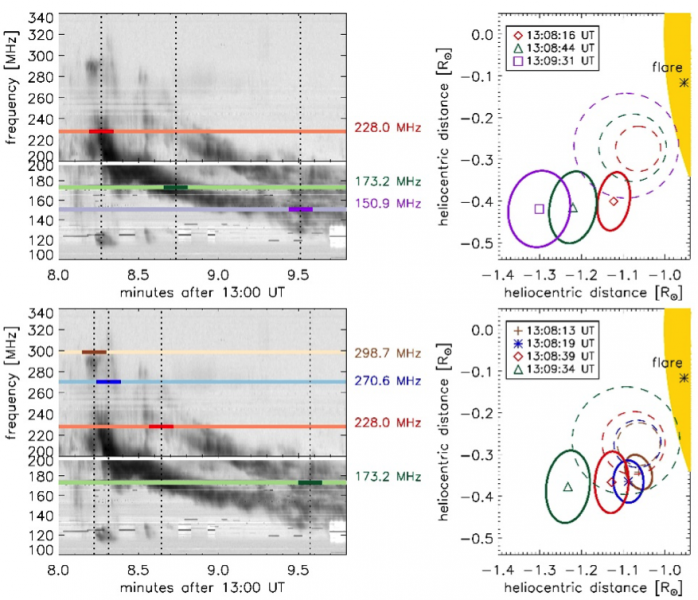
Figure 1: Left panels: Combined mid (100 − 196 MHz) and high (200−340 MHz) dynamic spectra obtained by BIR CALLISTO receivers covering the high-frequency range of the type II event detected on 2014 October 30. Darker-colored lines show the time intervals over which the NRH data have been averaged at a given frequency. Right panels: Locations of the centroids of 2D elliptical Gaussian fits (shown with 95% contour levels) to the type ii sources observed by NRH (plotted with colors corresponding to the frequencies in the left panels). Dashed circles correspond to the corresponding EUV front locations.
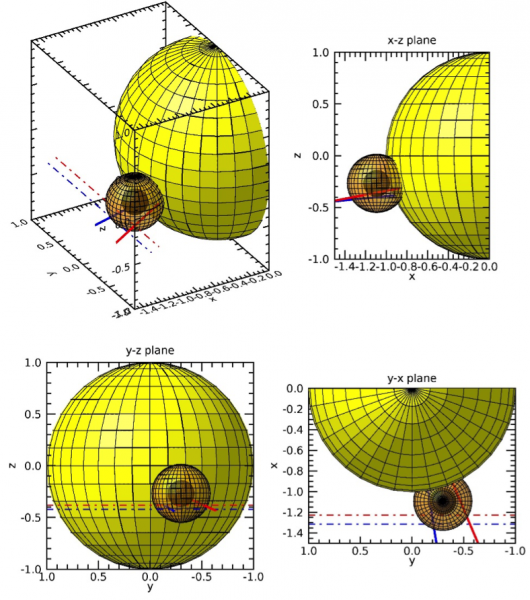
Figure 2. 3D model of the CME/shock surface (here shown at 13:09:30 UT). The x−z plane identifies the plane of the sky, where z is the north direction. The type II emission is supposed to be excited at the intersection of the spherical shock surface (identified by the light-brown sphere surrounding the dark-brown CME bubble) and the streamer axes. Blue and red straight lines identify the axes of the streamers and correspond, respectively, to type II emissions in the lower and upper branches of the splitted type II. Two lines of sight are depicted as red and blue lines with dots. The model explains the features observed by NRH at the various frequencies in Figure 1.
Results and conclusions
From the resulting derived profile of the standoff distance between the shock front and the leading edge of the CME, we inferred, by employing a method adapted by Gopalswamy & Yashiro (2011), the coronal magnetic field strength between 1.2 and 1.4 R⊙ from Sun’s center. When combined together with previous estimates, the radial profile of the magnetic field strength can be represented by a power law of the form B(r) = (12.6 ± 2.5) r -4 [G] in the heliocentric distance range 1.1 − 2.0 R⊙ (Figure 3).
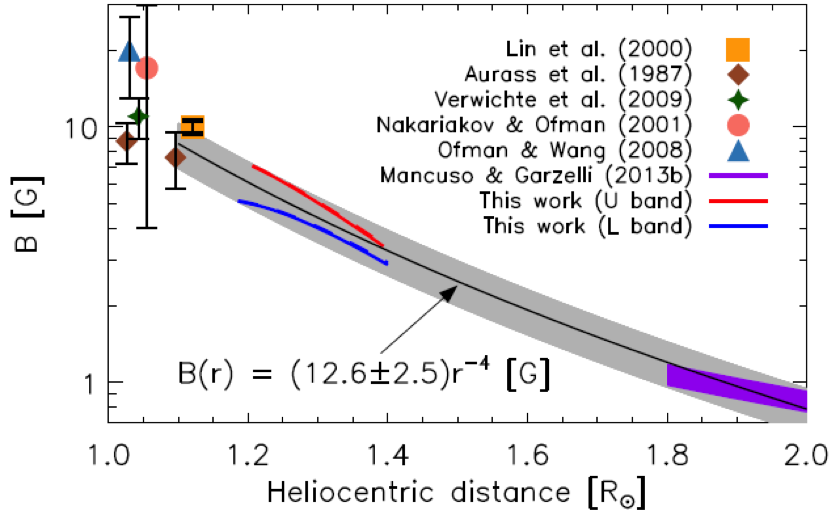
Figure 3. Magnetic-field radial profile as derived in this work (red and blue curves), together with estimates of B based on different methods. A simple radial profile (black line within gray boundaries) nicely fits our results and previous estimates in the range 1.1 − 2.0 R⊙.
Evidence for a shock was also found in AIA data near the angular position where the type II emission was excited. In a forthcoming paper, differential emission measure analysis of the EUV data will allow us to infer both the compression ratio and the temperature jump at the shock front.
Based on the recently published paper: Mancuso, S. Frassati, F., Bemporad, A. & Barghini, D. A&A, 624, L2 (2019), 10.1051/0004-6361/201935157
References
Gopalswamy, N., Yashiro, S.: 2011, ApJ, 736, L17
Mancuso, S., Raymond, J. C.: 2014, A&A, 413, 363
Smerd, S. F., Sheridan, K. V., Stewart, R. T.: 1975, ApL, 16, 23S
*Full list of authors: S. Mancuso, F. Frassati, A. Bemporad, D. Barghini