Solar flares are sudden explosive processes, that convert the energy of the magnetic field into the kinetic energy of electrons and ions. Since the beginning of the century, millimeter observations of solar flares became routinely possible at a few frequencies with limited spatial resolution (see Kaufmann 2012, as a review). One of the most puzzling aspects of the observations at millimeter wavelengths (200-400 GHz) is the presence, in some flares, of a bright spectral component that grows with frequency. This emission is about hundred trillion times more powerful than the power from the active millimeter full body scanners used in airports around the world.
The large flux of ~104 solar flux units (s.f.u.) at 400 GHz in some flares and a noticeable correlation with hard X-ray emission quickly led to the proposal that the emission is likely associated with accelerated non-thermal electrons (Kaufmann et al. 2001). The measurement of radio emission source sizes could provide additional observational constraints. However, there are currently no reliable source size measurements near 400 GHz and there is a long list of proposed emission mechanisms (e.g. Kaufmann 2012, Fleishman & Kontar, 2011, Zaitsev et al, 2014), which, unfortunately, have several assumptions that cannot be verified observationally.
However, the recent analyses of the relationship between the area of flare ribbons and the flare millimeter component, suggests that a thermal emission model, in which radio emission originates from the transition region of solar flare ribbons perturbed by flare-accelerated electron heating can explain the puzzling observations.
Observations and model comparison
A total of 17 solar flares with radio flux observations at millimeter range have been used in the study. For the selected events, the spectral indexes determined by radio fluxes at 212 GHz and 405 GHz are found to be consistent with several emission mechanisms including the optically thick free-free emission.
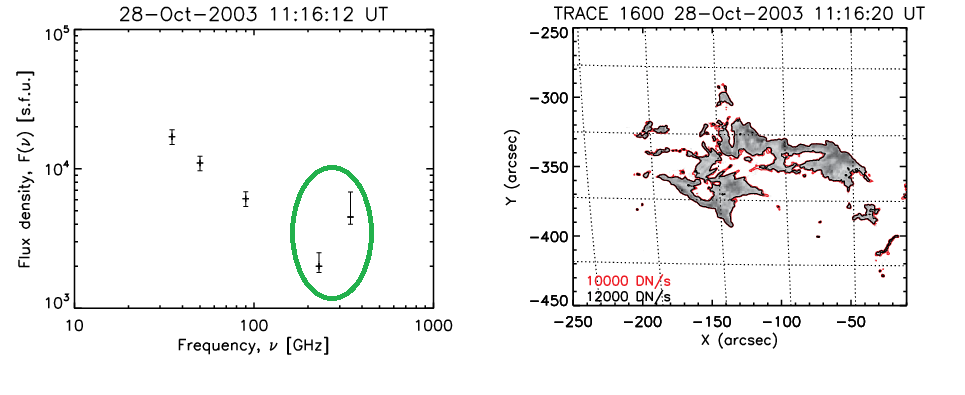
Figure 1 – The flux density spectrum showing the rising millimeter component (shown by green ellipse) above 200 GHz (left) and UV solar flare ribbon observed by TRACE satellite (right). The figure from Kontar et al, 2018.
The observed spectral flux density is proportional to the area of the emitting source due to the Rayleigh-Jeans relation. Therefore, the area is an important parameter for a thermal emission model. If the millimeter emission originates from optically thick thermal plasma in the upper chromosphere/transition region, then the area of the heated plasma (flare ribbon area) should be sufficient to provide the observed radio flux.
To evaluate flare ribbon area, UV images have been studied at the 1600 Å passband, obtained from the Transition Region and Coronal Explorer (TRACE) and from the Solar Dynamics Observatory Atmospheric Imaging Assembly (SDO/AIA). Figure 2 shows that all radio-fluxes observed can be explained by radiation from an optically thick plasma with the temperature between 104 and 106 Kelvin, which is typical for the transition region of solar atmosphere.
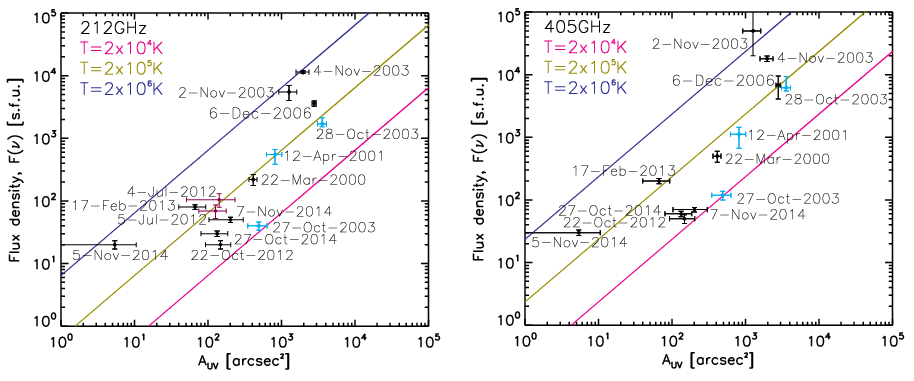
Figure 2 – Observed spectral flux density (crosses with error bars) and the flux density (solid lines) at 212 GHz (left) and 405 GHz (right) predicted by the flare ribbon emission model for transition region temperatures are shown by pink, dark yellow and dark blue lines respectively.
It is important to note that relatively dense plasma heated by energetic electrons to temperatures 0.1-1 million Kelvin (MK) leads to enhanced radiation, so that the radiation losses would lead to effective cooling. The estimates of radiative cooling time suggest that the plasma can quickly (at sub-second scale) cool if the heating time is greater than the radiation loss time. Hence, the interaction between non-thermal electron heating and the radiative cooling of dense plasma can explain the observed sub-second variability of flare millimeter emission.
Conclusions
The large spectral fluxes of the observed millimeter range (or sub-THz) emission are proposed to be associated with the large areas of these flare ribbons. Then, the millimeter range emission is produced by thermal plasma at the heated flare ribbons. Flares which demonstrate extended flare ribbons should give large fluxes at millimeter frequency range, which is consistent with the observations. Then, the thermal emission from an optically thick transition region and/or low coronal plasma, with temperatures between 0.1-2~MK produces a spectrum growing with frequency as required by the observations. The comparison of flare-ribbon model with existing observations show the millimeter spectral flux density (200-400 GHz) in all flares studied can be explained by the model.
Based on the recently published paper: Kontar, E. P.; Motorina, G. G.; Jeffrey, N. L. S.; Tsap, Y. T.; Fleishman, G. D.; Stepanov, A. V. Astronomy and Astrophysics, 620, id. A95 (2018), DOI: 10.1051/0004-6361/201834124
References
Fleishman, G. D., & Kontar, E. P. 2010, ApJ, 709, L127
Kaufmann, P., Raulin, J.-P., Correia, E., et al. 2001, ApJ, 548, L95
Kaufmann, P. 2012, Astrophys. Space Sci. Proc., 30, 61
Zaitsev, V. V.; Stepanov, A. V.; Kaufmann, P. 2014, Solar Physics, 289, 3017
*Full list of authors: Motorina, G. G.; Kontar, E. P.; Jeffrey, N. L. S.; Tsap, Y. T.; Fleishman, G. D.; Stepanov, A. V.