Plasmoids (or magnetic islands) are believed to play an important role in the onset of fast magnetic reconnection and particle acceleration during solar flares and eruptions. Direct imaging of flare current sheets and formation/ejection of multiple plasmoids in extreme ultraviolet (EUV) images, along with simultaneous X-ray and radio observations, provides significant insights into the mechanisms driving particle acceleration in solar flares. Previous studies have proposed that decimetric radio bursts and pulsations (drifting towards lower frequencies) can be produced by the ejection and coalescence of multiple plasmoids in the flare current sheet (Kliem, Karlický & Benz 2000). Drifting pulsating structures (DPSs) in decimetric radio bursts likely indicate the intermittent nature of energy release in the flare current sheet, and signature of radio emission from electrons accelerated during the ejection and coalescence of plasmoids (Karlický & Barta 2011). Simultaneous EUV imaging of bidirectional plasmoids in flare plasma/current sheet and the associated DPS in radio have been observed previously (Kumar & Cho, 2013).
In this nugget, we briefly discuss EUV imaging of plasmoids formed in flare current sheets underneath erupting flux ropes during two successive flares on 2015 April 22. The bidirectional plasmoids were associated with quasiperiodic pulsations (QPP; Nakariakov & Melnikov, 2009) in X-ray (soft/hard) and radio (decimetric) wavelengths. The flux rope appeared only in the hot channels (131/94 Å) during the first flare. We present direct imaging of the formation of double coronal X-ray sources at both ends of the flare current sheet during the ejection and coalescence of multiple plasmoids. The erupting flux rope during the second flare apparently undergoes kink instability and the formation of a plasma/current sheet along with multiple plasmoids propagating bidirectionally. In both cases the flux ropes reached a height of about 45 Mm (60 arcsecs) above the limb but remained confined within the overlying strapping field of the active region, thus failing to produce CMEs.
Observations
The active region NOAA 12322 was located on the west limb (N11W91) on April 22 2015. We studied two limb flares (C3.8, M1.1) and the associated flux-rope eruption from this AR on 22 April 2015. Both flares were nearly homologous and occurred successively from the same polarity inversion line (PIL) of the AR. According to the GOES soft X-ray flux profile, the first flare (C3.8) started at 07:59 UT, peaked at 08:06 UT, and ended at about 08:24 UT. The second flare (M1.1) started at 08:28 UT, peaked at 08:44 UT, and ended around 08:58 UT.
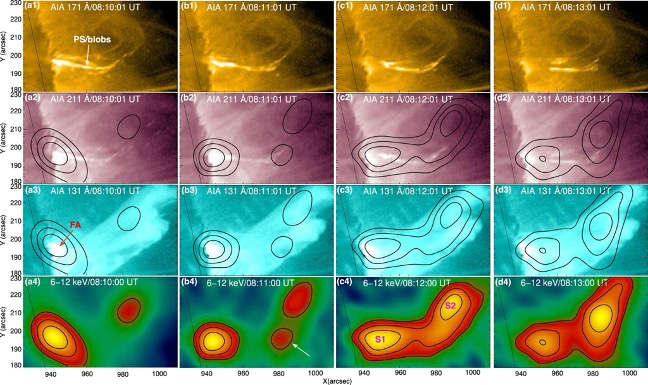
Figure 1: Evolution of X-ray sources (6–12 keV) during the first flare (C3.8) from 08:10 to 08:13 UT. AIA 171, 211, and 131 Å images during the QPPs detected in the decay phase of the flare. RHESSI images in the 6–12 keV energy band are overlaid on AIA 211 and 131 Å images. The contour levels are 40%, 60%, and 80% of the peak intensity. S1 and S2 represent double coronal sources.
To observe the evolution of the RHESSI X-ray sources during the QPPs, we reconstructed RHESSI images in the 6-12 keV range using the CLEAN algorithm. The AIA 171 and 211 Å images exhibit a bright plasma sheet and blobs during 08:10-08:13 UT (Figure 1), while the AIA 131 Å images show the bright flare arcade (FA) and flux rope. The RHESSI image at 08:10 UT reveals two sources above the limb (Figure 1(a4)). The lower source coincides with the flare arcade, while the upper source aligns with the top portion of the flux rope. Notably, we detected simultaneous X-ray (6-12 keV) and radio bursts during 08:11:30-08:12:30 UT (see Figure 1(a)). At 08:11 UT, the RHESSI image shows an additional source (marked by an arrow, Figure 1(b4)), which is spatially aligned with the top part of the plasma sheet with blobs. Later, at 08:12 UT, we observed an intensity increase and extension of both the upper and lower sources (S1, S2).
At 08:14 UT, we observed another faint source, S3, between S1 and S2 (Figure 2(a4)). One minute later, the source had moved up about 12 arcsecs in the RHESSI image. The estimated speed of S3 is around 150 km/s. Simultaneously, we noticed a decrease in the height of S1 (Figure 2(b4)). RHESSI contours overlaid on AIA images reveal that source S3 coincides with blobs near the apex of the plasma sheet. Source S1 fades as its height increases during 08:17-08:19 UT, while source S2 remains bright (Figure 2(c4,d4)). The source S1 disappeared after 08:20 UT and source S2 also faded gradually during the decay phase of the flare.

Figure 2: Evolution of X-ray sources (6–12 keV) during the first flare (C3.8) from 08:14 to 08:19 UT. AIA 171, 211, and 131 Å images during the QPPs detected in the decay phase of the flare. RHESSI images in the 6–12 keV energy band are overlaid on AIA 211 and 131 Å images. The contour levels are 40%, 60%, and 80% of the peak intensity. S1 and S2 represent double coronal sources. S3 is the faint source that appeared between S1 and S2.
To measure the temporal evolution and kinematics of the blobs formed in the flare plasma sheet, we created time-distance (TD) EUV intensity plots along and across the plasma sheet using AIA 171 Å images during the first flare (C3.8; 08:00-08:30 UT). The TD intensity plot along the plasma sheet shows the ejection of multiple blobs above the flare arcade during the flare impulsive phase (08:00-08:11 UT; Figure 3 (a)). The speeds of the upward-moving blobs along the tracked paths are 228, 203, 208, 295, 323, 370, and 210 km/s. The TD intensity plot across the plasma sheet reveals the blobs passing through the slit (Figure 3 (b)). The blobs were detected in the plasma sheet until 08:20 UT and disappeared afterward. The white curve on the right y-axis represents the average intensity of the blobs, which is extracted between the two horizontal dashed lines in panel (a).
The Fermi GBM light curve shows the X-ray emission in the 6-12, 12-25, and 25-50 keV channels (Figure 3(c)). The X-ray emission reveals QPPs in the 6-12 and 12-25 keV bands during 08:00-08:20 UT, with only weak emission in the 25-50 keV band (08:00-08:06 UT). The ejection of blobs is nearly associated with the X-ray emission peaks (marked by arrows) in the 6-12 and 12-25 keV bands during the flare impulsive phase (four cycles during 08:00-08:08 UT). Interestingly, QPPs also appear in the same X-ray bands during the flare decay phase, 08:11-08:20 UT. The dynamic radio spectrum shows nearly simultaneous decimetric/metric radio bursts (800-150 MHz) with the X-ray peaks during the flare impulsive and decay phases (Figure 3 (d)). The radio/X-ray emission stopped at 08:20, coinciding with the disappearance of the blobs in the plasma sheet.

Figure 3. X-ray and radio emissions associated with the ejection and merging of blobs during the first flare (C3.8), from 08:00–08:30 UT. (a) and (b) TD intensity plot along slices P1Q1 and P2Q2 using AIA 171 Å images. The white dotted lines represent the tracks used to estimate the speeds of the upward-moving blobs. The white curve in (b) represents the mean intensity (arbitrary units) extracted from between the two green dashed lines in (a). (c) Fermi-GBM counts in the 6–12, 12–25, and 25–50 keV energy bands. (d) ORFEES radio dynamic spectrum (144–1004 MHz).
For the first time, we observed a double structure of the plasma/current sheet (as shown in the MHD simulation, i.e, Kliem et al. 2010) with multiple propagating blobs below the erupting flux ropes. We interpret these blobs as plasmoids formed by reconnection in the flare current sheet. During the first flare (C3.8), we observed upward-moving reconnection outflows traced by multiple plasmoids (speed: 200-370 km/s) and the formation of a hot flux rope during the eruption.
During the first flare (C3.8), we detected double coronal X-ray sources (6-12, 12-25 keV) located at both ends of the plasma sheet (i.e., below and above the reconnection site). The lower source was located above the flare arcade, while the higher source was observed near the reconnection outflow, where multiple plasmoids merged with the underside of the halted flux rope. The flux rope appearing in the hot channels was observed during magnetic reconnection at the flare plasma/current sheet. In addition, we observed a faint X-ray source (6-12 keV) that appeared between the double X-ray sources (S1, S2) and was co-spatial with EUV plasmoids in the plasma sheet. The speeds of the upward-moving faint source and the EUV plasmoids are consistent.
Prior to the second flare (M1.1), a filament within the flux rope rose slowly (35 km/s) associated with brightening between its legs. The flux rope showed evidence of kink instability and the formation of two bright plasma sheets on the inner surfaces of its legs, joined by a central flare current sheet. The speeds of the upward and downward moving plasmoids were 134-330 km/s and 82-235 km/s, respectively, with plasmoid sizes ranging from 2-3 arcseconds. We observed decimetric radio bursts (evidence of electron injections) associated with the formation/ejection and coalescence of plasmoids into the trailing edge of the flux rope during the impulsive phase of the M1.1 flare.
Summary
We reported the direct imaging of the formation and ejection of multiple plasmoids in flare current sheets beneath erupting flux ropes, along with QPPs in X-ray and radio wavelengths. The observations confirm:
(i) that the X-ray double coronal sources observed by RHESSI are located at both ends of the flare current sheet, and formed during plasmoid-mediated reconnection in the sheet;
(ii) the faint transient source that appeared between the double coronal sources is most likely associated with upward-moving plasmoids;
(iii) the presence of a flare current sheet with double structure and multiple plasmoids, as predicted by an MHD simulation of kink-unstable flux rope (Kliem et al. 2010);
(iv) the formation of a plasma/current sheet at the leading edge of the kink-unstable flux rope during its encounter with the overlying flux system;
(v) that the coalescence of upward-moving plasmoids at the underside of the flux rope is accompanied by decimetric radio bursts;
(vi) X-ray/radio QPPs (P=10 s, 100 s) are associated with ejection and coalescence of plasmoids in the flare plasma/current sheet.
These findings enhance our understanding of plasma heating and the quasi-periodic acceleration of electrons via plasmoid-mediated reconnection in flare current sheets below erupting flux ropes. The production of energetic electrons through the ejection and coalescence of plasmoids in the plasma sheet has broad applicability to understanding fast magnetic reconnection in solar, heliospheric, and magnetospheric current sheets. The direct imaging of plasmoids and associated QPPs provides key insights into plasmoid-mediated magnetic reconnection and particle acceleration, supporting theoretical models of these processes during solar flares. In the future, similar flare events along with simultaneous EUV, radio, and hard X-ray imaging will yield further insights into the electron acceleration sites associated with plasmoids during magnetic reconnection in solar eruptions.
Based on a recent paper by Pankaj Kumar, Judith T. Karpen, and Joel T. Dahlin X-Ray/Radio Quasiperiodic Pulsations Associated with Plasmoids in Solar Flare Current Sheets (2025), ApJ, 980, 158. DOI: 10.3847/1538-4357/ada293
References
Karlický, M., Bárta M. 2011, A&A, 733, 107.
Kliem, B., Karlický, M., & Benz, A.~O. 2000, A&A, 360, 715.
Kliem, B., Linton, M.~G., Torok, T., et al. 2010, SoPh, 266, 91.
Kumar, P. & Cho, K.-S. 2013, A&A, 557, A115.
Nakariakov, V.~M. & Melnikov, V.~F. 2009, SSR, 149, 119.