Coronal mass ejections (CMEs) are large-scale plasma and magnetic field expulsions from the solar corona into the heliosphere. The magnetic field entrained in the CME plasma is crucial to understanding their propagation, evolution, and geo-effectiveness. Among the different observables at radio wavelengths, spectral modeling of faint gyrosynchrotron (GS) emission from CME plasma has been regarded as one of the most promising remote observing techniques for estimating spatially resolved CME magnetic fields. Imaging the very low flux density CME GS emission near the Sun, which has orders of magnitude higher flux density, has proven rather challenging. After the first detection and modeling of spatially resolved faint GS emission from CME plasma by Batian et al. 2001, there are only a handful of studies (Maia et al. 2007, Tun & Vourlidas 2013, Bain et al. 2014, Mondal et al. 2020) which have managed to detect this emission.
This instrumental challenge has only recently been met using the high dynamic range imaging capability of the Murchison Widefield Array (MWA). With high dynamic-range spectropolarimetric meter wavelength solar images provided by the MWA, faint GS emissions from a CME are detected out to ∼8.3 solar radii, the largest heliocentric distance reported to date. For the first time in the literature, circular polarization (Stokes V) detection has jointly been used with total intensity (Stokes I) spectra to constrain GS models. We expected that the inclusion of polarimetric measurement would provide tighter constraints on the GS model parameters. Instead, we found that homogeneous GS models, which have been used in all prior works, are unable to model both the total intensity and circular polarized emission simultaneously. This strongly suggests the need for using inhomogeneous GS models to robustly estimate the CME magnetic field and plasma parameters.
A brief overview of observations
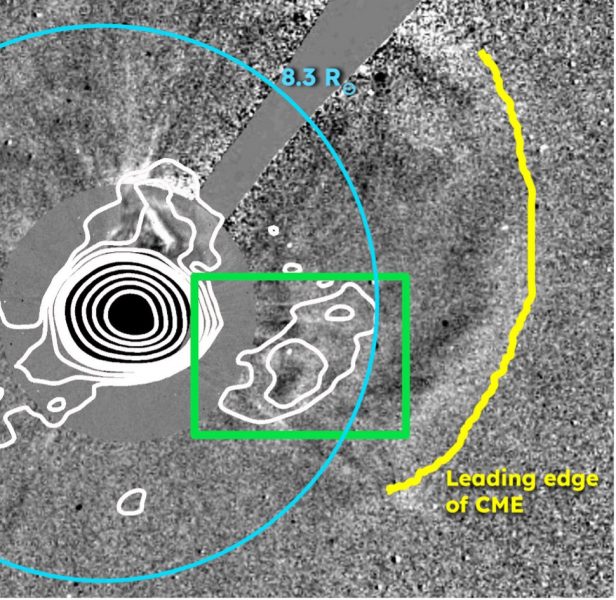
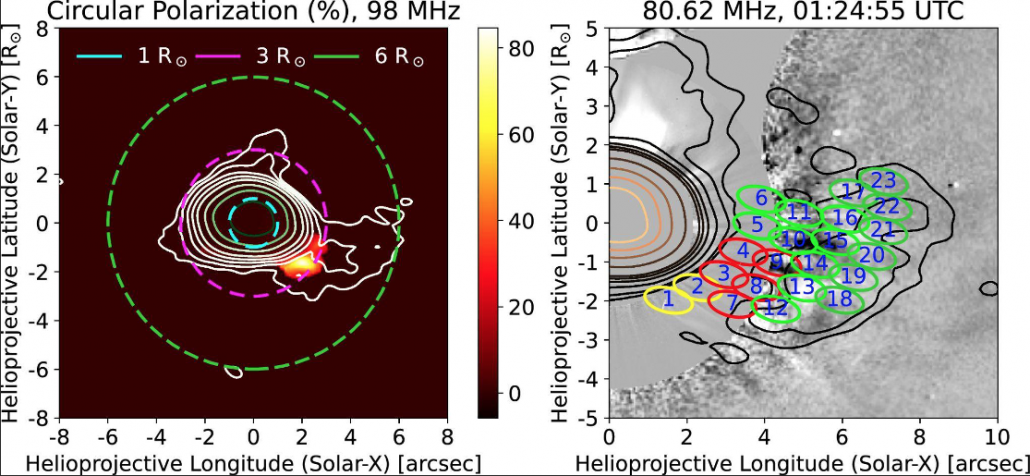
The CME studied in this work had a sky-plane speed of around 490 km/s, but was very faint in LASCO coronagraph images. This CME was reported as a partial-halo event in the LASCO CDAW catalog. This CME erupted from the southwestern active region (AR 12047), which was observed by the extreme ultraviolet images of the Atmospheric Imaging Assembly (AIA) onboard Solar Dynamics Observatory (SDO). This CME propagated towards the southwest. Radio observations were available covering frequencies between 80 to 240 MHz using the MWA. High dynamic range spectropolarimetric images provided by the state-of-the-art calibration and imaging algorithm, P-AIRCARS (Kansabanik et al, 2022, Kansabanik et al., 2023a) allow us to detect faint GS radio emission at multiple frequencies. Interestingly the radio emission is detected behind the leading edge of the CME, which has been hypothesied due to local reconnections in disturbed preexisting streamer and the CME. Total intensity (Stokes I) emission at 80 MHz is shown by contours overlaid on LASCO C2 and C3 base difference coronagraph images, and the CME leading edge is marked by the yellow curve. The CME studied in this work is marked by the cyan box in Figure 1. The noise achieved in this image is close to the thermal noise limit of the observation (~1.3 times). This implies that there is little further scope for improving the sensitivity by improving calibration or imaging. Despite the high quality of calibration and imaging achieved here, Stokes V emission is detected only at a single spectral chunk at 98 MHz over a small patch of the CME (left panel of Figure 2). Nonetheless, these observations place sensitive upper limits on the Stokes V flux densities for other regions and spectral chunks. The inclusion of the Stokes V detection and stringent Stokes V upper limits along with the Stokes I spectrum allow us to study the validity of common assumptions in the models used for modeling CME GS emissions.

Figure 1: Stokes I emissions at 80 MHz are shown by the white contours overlaid on the LASCO C2 and C3 running difference image of the CME. Contour levels are at 0.5%, 1%, 2%, 4%, 6%, 8%, 20%, 40%, 60%, and 80% of the peak flux density. Radio emission marked by the green box is associated with CME and is the focus of this work.
Spectral Modeling Using a Homogeneous Source Model
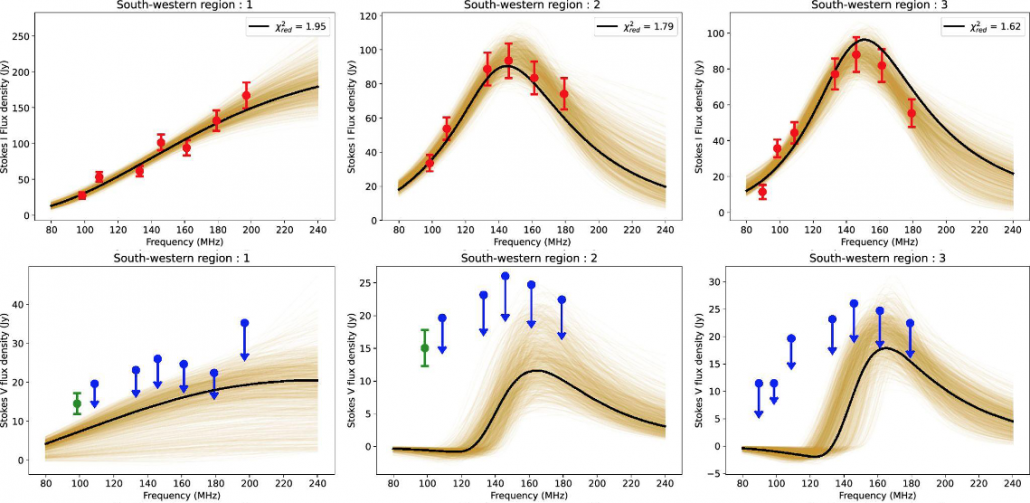
Faint GS radio emission from the CME is detected from 80 MHz to 180 MHz. Spatially resolved spectra are extracted at multiple independent adjacent point-spread-function (PSF) sized regions, marked by the ellipses in the right panel of Figure 2. Peaked Stokes I spectra (top panel of Figure 3) confirm the emission mechanism as GS emission. The simplest GS emission model assumes a homogeneous and isotropic distribution of non-thermal electrons following a single power-law distribution. To date, all modeling of the GS radio emissions from CMEs has been done based on this model (e.g., Batian et al. 2001, Tun & Vourlidas 2013, Bain et al. 2014, Mondal et al. 2020, Kansabanik et al., 2023b). In our approach, GS model parameters are constrained using a Monte-Carlo Markov-Chain (MCMC) based approach using both the Stokes I spectra, Stokes V detections, and stringent upper limits.
Observed and fitted Stokes I and V spectra for some of the regions are shown in Figure 3. It also shows GS spectra from 1,000 random realizations from the posterior distribution of GS model parameters. As is evident, the best-fit models are consistent with observed Stokes I spectra and Stokes V upper limits but inconsistent with the Stokes V detection. In a situation like the present, where a good model fit can be found for less constraining data (only Stokes V upper limits with Stokes I spectra), but as the constraints become tighter (inclusion of Stokes V detection), it is no longer possible to find a good model fit, strongly suggests the need to critically examine the possibility of one or more of the assumptions made by the model being violated. We examined the following key assumptions — restricting the electron energy distribution to a single power law, ignoring any anisotropy in the nonthermal electron pitch-angle distribution, and the assumption of homogeneity in the plasma present in the volume being modeled by the GS model. To examine these possibilities and attempt to identify the specific assumption being violated, we systematically examined these assumptions.

Figure 2: Left panel: circular polarization image at 98 MHz. The background color map shows the percentage of circular polarization and the contours represent the Stokes I emission. Right panel: regions of the CME where spectra have been extracted. Red regions are those where spectrum fitting is done. Spectrum modeling is not done for green regions. Spectrum fitting is also done for yellow regions, which also have Stokes V detection at 98 MHz.
Conclusion
Synthetic spectrum analysis showed that among the multiple assumptions made in the regularly used GS model, the homogeneous distribution of plasma and magnetic fields along the LoS has the strongest effect on the Stokes V GS spectrum. However, with the limited constraints available from the best observations available today, it is difficult to constrain an inhomogeneous GS model. Based on the results from present-day instruments like the MWA, there is no doubt that the even more sensitive and wider bandwidth spectropolarimetric imaging from the upcoming instruments, like the Square Kilometre Array Observatory expected to become available towards the end of this decade, and the Next Generation Very Large Array, and the Frequency Agile Solar Radiotelescope; aided by the multi-vantage point coronagraph observations will enable GS modeling to be used as a routine and robust remote sensing technique for estimating CME plasma parameters spanning a large range of coronal heights.

Figure 3. Observed and fitted spectra of some of the regions marked by red ellipses in Figure 2 using a homogeneous GS model. The Stokes I spectra are shown in the first row. The Stokes V spectra are shown in the second row.
Additional info
Based on a recent paper by Kansabanik, D., Mondal, S. and Oberoi, D. 2024 ApJ 968 55, https://doi.org/10.3847/1538-4357/ad43e9
Full list of authors: Devojyoti Kansabanik 1,2,3, Surajit Mondal4 , Divya Oberoi3
1 Cooperative Programs for the Advancement of Earth System Science, University Corporation for Atmospheric Research, Boulder, CO, USA
2 The Johns Hopkins University Applied Physics Laboratory, 11101 Johns Hopkins Road, Laurel, MD 20723, USA
3 National Centre for Radio Astrophysics, Tata Institute of Fundamental Research, Pune, India
4 Center for Solar-Terrestrial Research, New Jersey Institute of Technology, Newark, NJ, USA
References
Bastian, T. S., Pick, M., Kerdraon, A., Maia, D., & Vourlidas, A. 2001, ApJL, 558, L65
Bain, H. M., Krucker, S., Saint-Hilaire, P., & Raftery, C. L. 2014, ApJ, 782, 43
Kansabanik, D., Oberoi, D., & Mondal, S. 2022c, ApJ, 932, 110
Kansabanik, D., Bera, A., Oberoi, D., & Mondal, S. 2023a, ApJS, 264, 47
Kansabanik, D., Mondal, S., & Oberoi, D. 2023b, ApJ, 950, 164
Maia, D. J. F., Gama, R., Mercier, C., et al. 2007, ApJ, 660, 874
