Coronal mass ejections (CMEs) are large-scale expulsion of plasma and magnetic fields from the solar corona into the heliosphere. Magnetic field entrained in the CME plasma is crucial to understand their propagation, evolution, and geo-effectiveness. Among the different observables at radio wavelengths, spectral modeling of faint gyrosynchrotron (GS) emission from CME plasma has been regarded as one of the most promising remote observing techniques for estimating spatially resolved CME magnetic fields. Imaging the very low flux density CME GS emission in close proximity to the Sun with orders of magnitude higher flux density has, however, proven to be rather challenging. After the first detection and modeling of spatially resolved faint GS emission from CME plasma by Batian et al. 2001, there are only a handful of studies (Maia et al. 2007, Tun & Vourlidas 2013, Bain et al. 2014, Mondal et al. 2020) which have managed to detect this emission.
This instrumental challenge has only recently been met using the high dynamic range imaging capability of the Murchison Widefield Array (MWA). Although routine detection of GS is now within reach, the challenge has shifted to constraining the large number of free parameters in GS models, a few of which are degenerate, using the limited number of spectral points at which the observations are typically available. In this study, we demonstrate that high-fidelity and high dynamic range spectropolarimetric imaging with the MWA can provide robust constraints on the circular polarization of faint GS emission. Using this information along with the total intensity spectrum can significantly improve the constraints on plasma parameters of the CME.
A brief overview of observations
The CME studied in this work is a slow CME, having three-dimensional speed around 450 km/s. This CME erupted from the backside of the Sun, which was observed by the extreme ultraviolet imager onboard STEREO-B spacecraft. This CME propagated towards the solar North. Radio observations were available covering frequencies between 80 to 240 MHz using the MWA. High dynamic range spectropolarimetric images provided by the state-of-the-art calibration and imaging algorithm, P-AIRCARS (Kansabanik et al, 2022,Kansabanik et al., 2023a) allows us to detect faint GS radio emission at multiple frequencies and covering almost the entire white-light CME. Total intensity (Stokes I) emission at 80 MHz is shown by contours overlaid on LASCO C2 and C3 base difference coronagraph images (Figure 1). The CME studied in this work is marked by the cyan box in Figure 1. The noise achieved in this image is close to the thermal noise limit of the observation (~1.3 times). This implies that there is little further scope of improving the sensitivity by improving calibration or imaging. Despite the high quality of calibration and imaging achieved here, these observations are unable to detect circularly polarized (Stokes V) emission from this CME. Nonetheless, these observations place sensitive upper limits on the Stokes V flux densities. Inclusion of these stringent Stokes V upper limits along with Stokes I spectrum limits the phase space available for GS model parameters and hence improves their robustness.
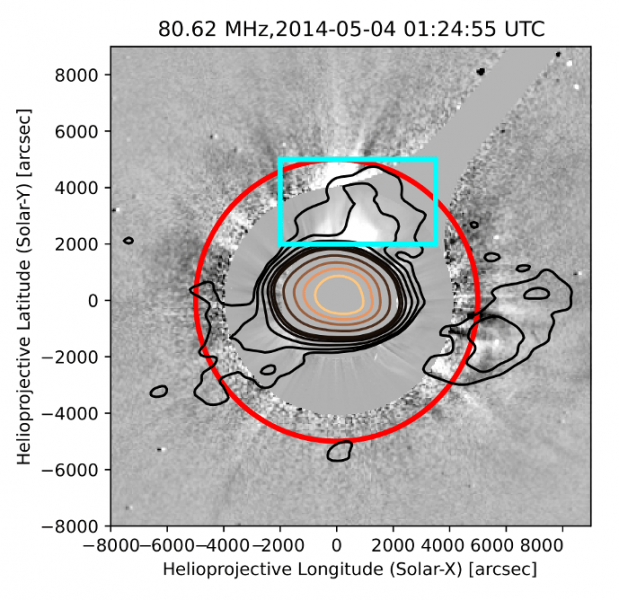
Figure 1: Radio emission from CME-1 at 80 MHz. Stokes I emissions at 80 MHz are shown by the contours overlaid on a base difference coronagraph image. The background shows the LASCO C2 and C3 coronagraph images from the nearest available timestamps. The inner white-light image is from the C2 coronagraph and the outer image is from the C3 coronagraph. Radio image is at 01:24:55 UTC. Contours levels are at 0.5%, 1%, 2%, 4%, 6%, 8%, 20%, 40%, 60%, and 80% of the peak flux density. The radio emission marked by the cyan box is from CME-1, which is detected on the sky plane out to 5.2 R⊙ shown by the red circle.
Spectro-polarimetric Modeling of the Faint GS Radio Emission
Faint GS radio emission from the CME is detected from 80 MHz to 145 MHz. Spatially resolved spectra are extracted at multiple independent adjacent point-spread-function (PSF) sized regions, as shown by the ellipses in Figure 2. Peaked Stokes I spectra (top panel of Figure 3) confirm the emission mechanism as GS emission.
The simplest GS emission model assumes a homogeneous and isotropic distribution of non-thermal electrons following a single power-law distribution. Even this simplistic GS model has ten free parameters and some of them show degeneracy. Constraining all of them only using Stokes I spectrum is not possible. Multi-vantage point observations using white-light coronagraphs provide independent estimation of thermal electron density and maximum allowed source depth for the GS model. Most other parameters are constrained using a Monte-Carlo Markov-Chain (MCMC) base approach using both the Stokes I spectrum and the spectrum of Stokes V upper limits. Observed and fitted Stokes I and V spectra for some of the regions marked in red in Figure 2, are shown in Figure 3. It also shows GS spectra corresponding to 1,000 random realizations from the posterior distribution of GS model parameters. As is evident, the best fit models are consistent with both observed Stokes I spectra and Stokes V upper limits.
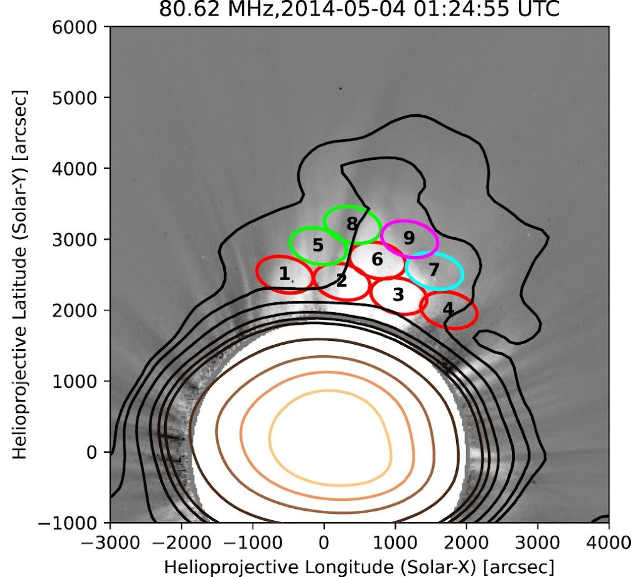
Figure 2: Regions where spectra have been extracted. The red regions are those where spectrum fitting is done and spectrum fitting is not done for green regions. Spectrum fitting is also done for region 7, which is marked by cyan, while keeping some parameters fixed. Region 9, which is marked by magenta, only has a single spectral point.
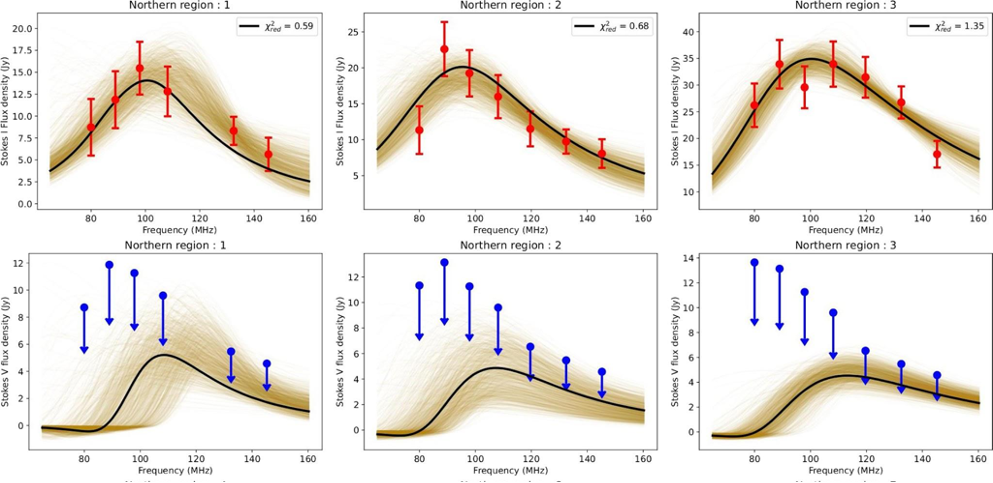
Figure 3. Observed and fitted spectra of some of the red regions shown in Figure 2. The Stokes I spectra are shown in the first row. Red points represent the observed flux densities. The Stokes V spectra are shown in the second row. Blue points represent the upper limits at each of the frequencies. The black lines represent the Stokes I and V GS spectra corresponding to the median values of the posterior distributions of the GS model parameters. Light-yellow lines show the GS spectra for 1000 realizations chosen randomly from the posterior distributions of the GS model parameters.
Posterior distributions of GS model parameters are shown in Figure 4 for two cases – using only Stokes I spectrum (blue contours) and using both Stokes I spectrum and Stokes V upper limits (maroon contours). It is evident GS parameters are better constrained when both Stokes I and V measurements are used.
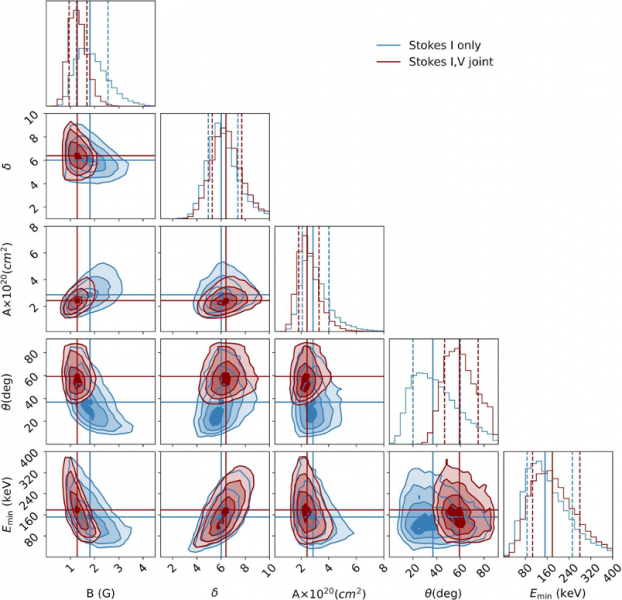
Figure 4: Comparison between Stokes I only and Stokes I, V joint modeling. Two-dimensional plots show the joint probability distribution of any two parameters. The contours are at 0.5, 1, 2, and 3σ. Blue contours represent the posterior distributions of parameters using only Stokes I spectrum. Maroon contours represent the posterior distributions using the joint Stokes I and V spectra. Magnetic field (B) and line-of-sight with magnetic field (θ) are better constrained by Stokes I and V joint fitting.
Discussion
Inclusion of Stokes V upper limits along with Stokes I spectrum significantly reduces the spread in the distribution function of the model parameters and breaks some of the degeneracies in the GS model, when compared to the situation when only Stokes I spectrum is used. The use of even stringent Stokes V upper limits jointly with Stokes I spectra enables us to exclude the part of the parameter space of GS models, which is consistent with the Stokes I spectra but not with the Stokes V upper limits. Examining the ranges of posterior distributions shows that the uncertainties in the estimates of line-of-sight angle with magnetic field have reduced by ~44% and that in magnetic field strength by ~30% on using joint Stokes I and V modeling.
This work marks the next step beyond the earlier attempts of estimating CME plasma parameters using GS emission. It demonstrates the usefulness of upper limits when used appropriately in conjunction with other available constraints. Based on the results from present-day instruments like the MWA, there is no doubt that the even more sensitive and wider bandwidth spectropolarimetric imaging from the upcoming instruments, like the Square Kilometre Array Observatory , the Next Generation Very Large Array, and the Frequency Agile Solar Radiotelescope; aided by the multi-vantage point coronagraph observations will enable GS modeling to be used as a routine and robust remote sensing technique for estimating CME plasma parameters spanning a large range of coronal heights.
Additional info
Based on a recent paper by Kansabanik, D., Mondal, S. and Oberoi, D. 2023, 2023 ApJ 950 164, https://doi.org/10.3847/1538-4357/acc385
Full list of authors: Devojyoti Kansabanik 1, Surajit Mondal 2 , Divya Oberoi 1
1 National Centre for Radio Astrophysics, Tata Institute of Fundamental Research, Pune, India
2 Center for Solar-Terrestrial Research, New Jersey Institute of Technology, Newark, USA
References
- Bastian, T. S., Pick, M., Kerdraon, A., Maia, D., & Vourlidas, A. 2001, ApJL, 558, L65
- Bain, H. M., Krucker, S., Saint-Hilaire, P., & Raftery, C. L. 2014, ApJ, 782, 43
- Maia, D. J. F., Gama, R., Mercier, C., et al. 2007, ApJ, 660, 874
- Mondal, S., Oberoi, D., & Vourlidas, A. 2020, ApJ, 893, 28
- Tun, S. D., & Vourlidas, A. 2013, ApJ, 766, 130
- Kansabanik, D., Oberoi, D., & Mondal, S. 2022c, ApJ, 932, 110
- Kansabanik, D., Bera, A., Oberoi, D., & Mondal, S. 2023, ApJS, 264, 47