Solar type II radio bursts appear in the spectrograph records as slowly drifting emission lanes from high to low frequencies. They are due to plasma oscillations caused by the electrons accelerated at the MHD shocks propagating outward in the solar atmosphere (Nelson et al. 1985, Mann et al. 1995). The plasma emission in a magnetic field gets split as ordinary ($O$) and extraordinary ($X$) modes. Since the propagation characteristics of these two modes are different, there will be a resultant circular polarization (Melrose et al. 1972). In the case of harmonic plasma emission, the associated $B$ can be estimated in a relatively simple manner. Sometimes two type II bursts occur in quick succession within a time interval of ${\sim}10$ min (Robinson et al. 1982). The occurrence of such events are attributed to either two successive flares or two successive coronal mass ejections (CMEs) or a flare and CME, or leading edge (LE) and flank of a CME (Mancuso et al. 2004). In this work, we distinguish the successive type II bursts based on their power spectral density (PSD) and magnetic fields ($B$).
Analysis and Results
The radio observations were carried out using with the newly developed GAuribidanur Pulsar System (GAPS, Kshitij et al. 2022) at the Gauribidanur Observatory (Ramesh 2011) of the Indian Institute of Astrophysics (IIA). We used data obtained in Extreme Ultra-Violet (EUV) at 193{\AA} with the Atmospheric Imaging Assembly (AIA, Lemen et al. 2012) on board the Solar Dynamics Observatory (SDO). Figure 1 shows two successive type II radio bursts from the solar corona on 2020 May 29. They were associated with a M1.1 class GOES soft X-flare observed during the interval ${\approx}$ 07:13 – 07:28 UT. The maximum in the flare emission occurred at ${\approx}$ 07:24 UT.
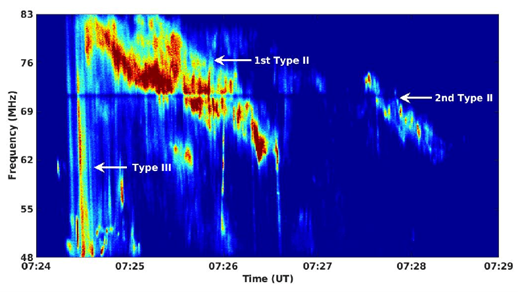
Figure 1: GAPS observations of transient radio emission from the solar corona on 2020 May 29. The relatively slow drifting emission during the intervals 07:24:30 – 07:26:30 UT and 07:27:30 – 07:28:30 UT are successive type II radio bursts.
The flare location was on the east limb of the Sun; hence the type II bursts are due to harmonic plasma emission since the corresponding fundamental (F) component from limb events as in the present case are likely to be occulted by the overlying corona and hence do not reach the observer. The degree of circular polarization $dcp$ values of for the two types II bursts are ${\approx}$ 0.14, and 0.07, respectively. These are consistent with the earlier reports on $dcp$ for type II bursts (Dulk et al. 1980). The SDO/AIA-193{\AA} running difference image obtained at ${\approx}$ 07:25 UT indicate that the 1st type II burst was associated with an EUV flux rope like structure propagating outwards from the same location as the flare. The estimated linear speed is ${\approx}$ 477 km/s in the SDO/AIA-193{\AA} field-of-view (FoV). The estimated speed of the MHD shock associated with the two bursts is ${\approx}$506${\pm}$ 33 km/s according to the commonly used $N_{e}$ models for the solar corona (Baumbach 1937). Gopalswamy et al. 2012 showed that for a propagating coronal disturbance like the EUV flux rope with LE at $r{\approx}$1.30$R_{\odot}$, the associated shock could be ahead by ${\approx}$0.15$R_{\odot}$ (shock standoff distance). Hence, we believe that the 1st type II burst (figure 1) is due to the LE of the EUV flux rope.
The SDO/AIA-193{\AA} running difference image obtained at ${\approx}$ 07:28 UT shows an upward rising coronal loop at $r{\approx}$1.21$R_{\odot}$ and PA${\approx}40^{ ‘}$ near the northern flank of the same flux rope associated with the 1st type II burst. There was only one CME seen in the Large Angle and Spectrometric Coronagraph C2 (LASCO C2, Brueckner1995) onboard the SOlar and Heliospheric Observatory (SOHO). The measurement position angle (MPA) and angular width were ${\approx}63^{ ‘}$ and ${\approx}37^{ ‘}$, respectively, which is reasonably consistent with the narrow bandwidth first type II burst. Any possibility of association between the 2nd type II burst and X-ray flare mentioned earlier is also minimal since the latter had almost ended when the burst was observed. Considering all the above details, we conclude that the coronal loop motion mentioned above is due to interaction between the earlier erupted EUV flux rope and the adjacent loops, and this resulted in the 2nd type II burst at the flank of the flux rope/CME (Reiner et al. 2003, Cho et al. 2007).
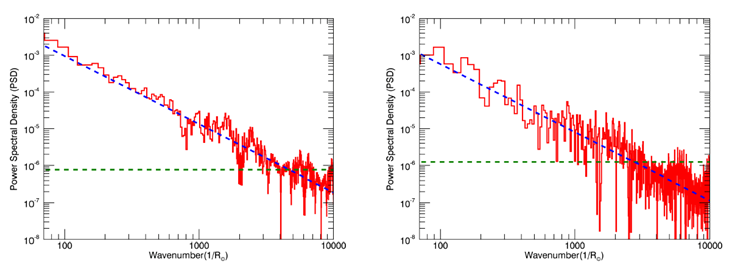
Figure 2. PSD corresponding to the first (left) and second (right) type II burst in Figure 1. The inclined blue dashed line is the least squares fit to the estimated PSD. The horizontal green dashed line indicates 5 $%$ significance level. The unit for PSD in the present case is $\rm W^{2}m$.
The fine structures and circular polarization exhibited by the successive type II bursts in Figure 1 are related to the coronal density turbulence and magnetic field in the source region of the bursts, respectively. To infer the former, we estimated the PSD of the two bursts at different epochs as described by Carley et al. 2021. The slope is ${\approx}$-1.85 for both the bursts (see Figure 2). But the amplitude of the PSD corresponding to the 2nd type II burst ($\rm {\approx}10^{-3}\,W^{2}m$) is ${\approx}2{\times}$ lesser than that of the 1st type II burst ($\rm {\approx}2{\times}10^{ 3}\,W^{2}m$). Similarly, the $dcp$ of the 2nd type II burst too is ${\approx}2{\times}$ lesser compared to that of the 1st type II burst. According to the quasi-2D turbulence models, interaction between emerging and evolving loops in the `magnetic carpet’ on the solar surface generates turbulence which is transferred into the corona and beyond (Zank et al. 2021). So, an increase or decrease in the magnetic field should lead to a corresponding change in turbulence (Potherat et al. 2017). Therefore, the ${\approx}50\%$ decrease in the PSD of the 2nd type II burst (w.r.t. the 1st type II burst) in the present case must be due to its $B$ being lower by ${\approx}50\%$ compared to that of the 1st type II burst.
Conclusions
We have reported spectral and polarimeter observations of two weak, successive low-frequency (${\approx}$85\,-\,60\,MHz) type II radio bursts in the solar corona. Our results indicate that the 1st and 2nd type II bursts were generated by the leading edge of a flux rope / CME, and interaction of its flank with a neighboring structure, respectively. The power spectral density and magnetic field strength of the 2nd type II burst (CME LE) are $2{\times}$ lesser than that of the 1st type II burst (CME flank) at the same $r$. Such studies are expected to be important since there are reports that interplanetary CMEs with turbulent sheath region ahead of its LE drive stronger geomagnetic activity (Kilpua et al. 2021). Such CMEs provide useful reference for space weather forecasting, especially for CME arrival and geoeffectiveness (Wang et al. 2020). This suggests a possible working hypothesis for future research, i.e., whether sensitive observations of weak, successive coronal type II radio bursts as reported in the present work can be proxies for deflected CMEs close to the Sun.
Based on the recent paper: Ramesh, R., et. al.: Solar coronal density turbulence and magnetic field strength at the source regions of two successive metric type II radio bursts. The Astrophysical Journal, Volume 943, 43, DOI: https://doi.org/10.3847/1538-4357/acaea5
References
Robinson, R. D. and Sheridan, R. T. (1982). Pub. Astron. Soc. Aust., Volume 4, 392.
Cho, K.-S., Lee, J., Moon, Y.-J., Dryer, M., Bong, S.-C., Kim, Y.-H. and Park, Y.-D. (2007). Astronomy and Astrophysics, Volumne 461, pp 1121-1125.
Carley, E. P., Cecconi, B., Reid, H. A., Briand, C., Sasikumar Raja, K. and Masson, S. (2021). The Astrophysical Journal, Volume 921, 3.
*Full list of Authors: R. Ramesh, C. Kathiravan, A. Kumari