Small scale energy releases on the Sun e.g., flaring bright points, active region transient brightenings, etc. have been studied using X-ray and radio observations. The observations of low frequency radio type III bursts in associated with X-ray bright point flares (Kundu et. al. 1980) and coronal X-ray jets (Aurass et. al. 1994) indicated that the latter are capable of accelerating particles to non-thermal energies, as well as producing the heated material detected in soft X-rays. These results imply that radio observations are an useful complimentary tool for observing signatures of weak, transient energy releases in the solar atmosphere since the related non-thermal emission can be easily detected (Benz 1995). X-ray microflares are another independent observational evidence for the small-scale energy releases in the solar atmosphere (Lin et. al. 1984). Recent spectroscopic imaging observations indicate that the weak non-thermal radio emission at low frequencies is more like type I radio bursts (Mondal et. al. 2020). However, there are not any detailed study about their other wavelength counterparts. In this work, we studied weak type I radio burst emission during the same time as soft X-ray observations of a sub-A class level flare and EUV brightening from the ‘quiet’ solar corona in the complete absence of active regions and flare/coronal mass ejection (CME) activity.
Analysis and Results
The radio observations were carried out using the different facilities operated by the Indian Institute of Astrophysics (IIA) in the Gauribidanur Observatory (Ramesh 2011). The patches of bright emission in the spectra (Figure 1) during the period $\approx$ 05:09-05:11 UT are typical of type I or noise storm bursts from the solar corona (see for e.g. Iwai et. al. 2013). It is widely believed that the bursts are due to plasma radiation at the fundamental plasma frequency (Melrose 1980). The bright patched in Figure 1 are similar to type I bursts. There were no active regions and no H$\alpha$ and/or GOES soft X-ray flares were reported during the burst interval.
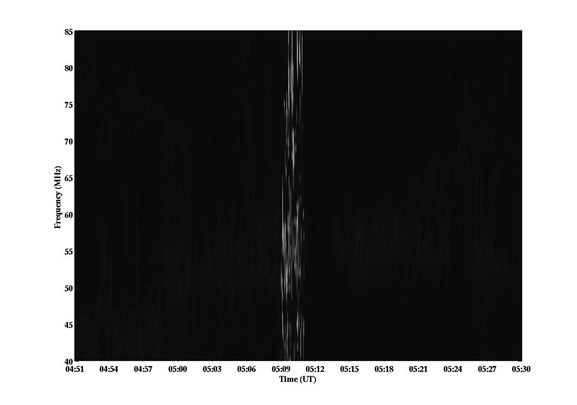
Figure 1. GLOSS dynamic spectrum of the solar radio emission observed on 2020 April 21. The bright emission during the period $\approx$ 05:09 05:11 UT correspond to the type I solar radio bursts.
With the X-ray flare observed on 2020 April 21 at ${\approx}$05:10 UT, there was also an EUV brightening observed with the SDO/AIA at 94{\AA} around the same time as the type I radio bursts. The location of the northern radio contour with label ‘1’ in Figure 3 correspond reasonably well with the location of the EUV brightening. The observations of the type I radio bursts over a larger area compared to the EUV brightening could be due to the divergence of the associated field lines (Li et. al. 2017). We speculate that the presence of the two spatially separated radio contours 1 & 2 suggests interaction at two different locations between inclined, large magnetic loops with foot points in the same hemisphere, north in the present (Wild 1968).
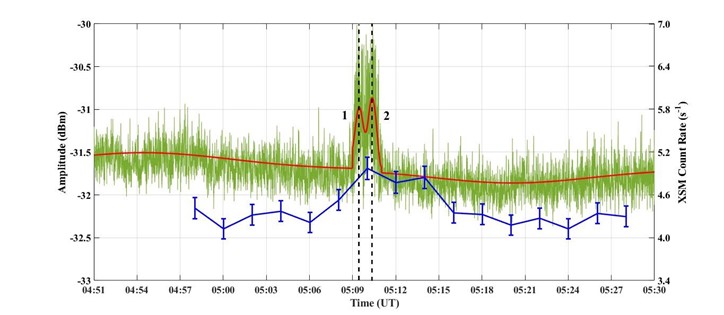
Figure 2. The ‘green’ colour plot corresponds to the frequency averaged time profile of the GLOSS dynamic spectrum in Figure 1. The labels 1 & 2 indicate the epochs of maximum radio emission from the regions 1 & 2 in Figure 3, respectively. The ‘blue’ colour profile is the light curve of the soft X-ray emission from the Sun close to the same epoch as the radio observations.
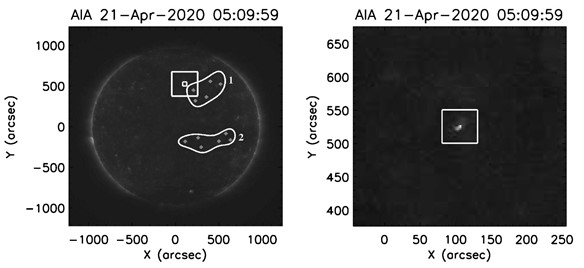
Figure 3. A composite of the GRAPH difference image of the bursts in Figure 1 at 80 MHz and the EUV observations at 94{\AA} with the SDO/AIA around the same time as the radio and X-ray observations in Figures 1 & 2 on 2020 April 21. The bigger and smaller ‘boxes’ in the left panel image indicate the region around the EUV brightening and the location of maximum emission, respectively. The ‘zoomed’ version of the same brightening is shown in the right side panel. The peak flux density in the GRAPH observations is $\rm {\approx}\,241\,Jy$. Its nearly the same for the contours 1 & 2, which correspond to the two maxima 1 & 2 in the radio time profile in Figure 2, respectively.
The peak flux of the XSM flare is $\rm {\approx}6{\times}10^{-9}\,Wm^{-2}$ (weak event). The total duration of the event is ${\approx}$5 min. There appears to be two ‘peaks’ in the flare light curve with a noticeable difference between the corresponding count rates. The type I radio bursts are present only during the initial phase of the X-ray emission. The total duration of the radio event is smaller $({\approx}$2 min). Assuming that both the X-ray and radio events are related to a common primary phenomenon, the comparatively shorter duration of the radio event indicates that the electrons responsible for its occurrence are probably thermalized quickly. As a result, they cannot travel to larger heights in the corona from where the low frequency radio emission primarily originates (Mondal et. al. 2020). The shorter duration of the radio bursts could be also due to the emission being non-thermal in nature as compared to the soft X-ray emission (Reid et. al. 2017).
The energy associated with the type I burst was $\rm E\,{\approx}\,8.1{\times}10^{22}$ erg (minimum value). Both the type I bursts and the associated X-ray emission were short lived. Therefore, it is likely that the electron acceleration responsible for the type I bursts were triggered by the same process responsible for the associated X-ray microflare (Crosby et. al. 1996). We find that the area enclosed by the contours in Figure 3 is nearly same as that of the GRAPH ‘beam’ size at 80 MHz mentioned earlier, i.e. ${\approx}5^{’}{\times}7^{ ’}$, which is very large compared to other high resolution observation results (Melrose 1980, Mugundhan et. al. 2018). So, it is possible that the contours in Figure 3 correspond to an ensemble of type I burst sources, each of size ${\approx}14^{’}{\times}14^{’}$. We calculated the maximum possible total energy of the type I bursts as ${\approx}\,5.3{\times}10^{25}$ erg. This is in reasonable agreement with the range of energies for the soft X-ray microflares reported by Vadawale et. al. 2021. The above numbers and arguments confirm that the type I radio bursts are an independent ground based observational tool to probe weak activity in the `quiet’ regions of the corona also in addition to its known association with sunspot activity.
Conclusions
We presented co-temporal/co-spatial observations of weak type I radio bursts, X-ray microflare, and EUV brightening from the ‘quiet’ Sun which was completely devoid of any active regions. There is close agreement between the energy budgets estimated independently from the radio and X-ray observations. Combined investigations of weak energy releases observed at the same time in all the aforementioned domains would be helpful to understand the energies deposited at different levels in the solar corona in addition to the associated mechanisms themselves.
Based on the recent paper: Ramesh, R., et. al.: Radio, X-Ray, and Extreme-ultraviolet Observations of Weak Energy Releases in the “Quiet” Sun. The Astrophysical Journal Letters, Volume 918, Issue 1, id.L18, 6 pp, DOI: https://doi.org/10.3847/2041-8213/ac1da3
References
Kundu, M. R. & Gopalswamy, N. (1990). Solar Physics, Volume 129, Issue 1, pp.133-152
Mondal, S., Oberoi, D. & Mohan, A. (2020). The Astrophysical Journal Letters, Volume 895, Issue 2, id.L39, 7 pp.
Ramesh, R., Mugundhan, V. & Prabhu, K. (2020). The Astrophysical Journal Letters, Volume 889, Issue 1, id.L25, 5 pp. (2020)