Solar noise storms are known to be related to small and large scale magnetic field enhancements at active regions (Elgaroy 1977, Li et al.,2017). However, the mechanism still remain unclear. Their high spectro-temporal variability and ubiquity of weak events demanded sub-second and sub-MHz scale imaging with high dynamic ranges (DRs) to reliably study emission from individual sources. Using high DR snapshot spectroscopic images from the Murchison Widefield Array, this work explores the complete structural evolution of a noise storm source associated with a microflare for the first time. Combining this with the earlier results on the event from EUV analysis and magnetic field $\vec{B}$ modelling presented in Mohan et al.,2019 (M19; CESRA nugget), this work draws insights on the local $\vec{B}$ evolution during the event.
Event & Analysis
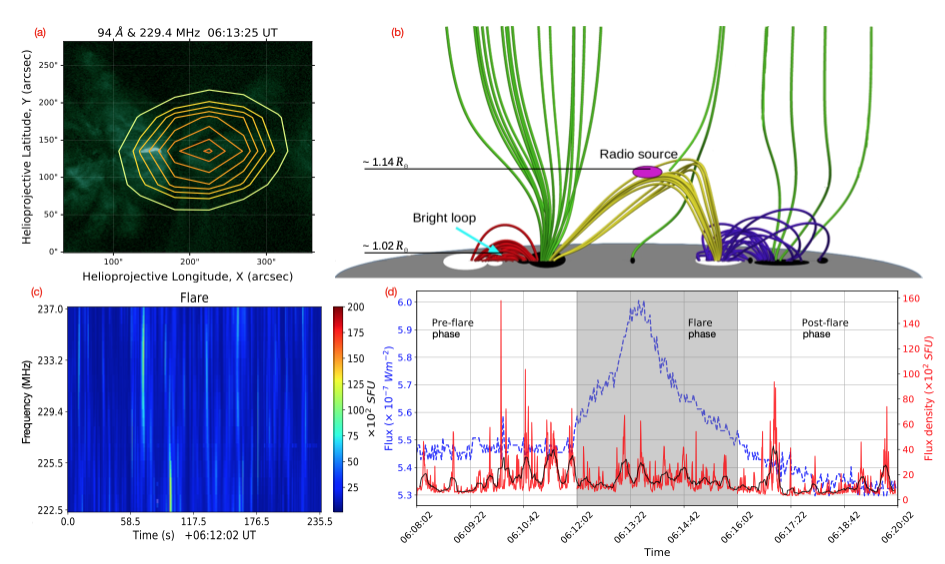
Figure 1 summarises the event and analysis. The noise storm source had a 2D Gaussian morphology in the images (e.g. Fig. 1a) made across 15 MHz band (df = 160 kHz) centred around 200 MHz for 12 min duration (Nov 3, 2014; 06:08 – 06:16 UT) at a cadence of 0.5 s. NLFF modelling by M19 had showed that a bright active region loop that underwent a microflare was linked to the noise storm via a common magnetic footpoint.

Figure 1 – (a) The noise storm source overlaid on AIA 94 Angstrom image showing its association with the flaring loop. (b) NLFF extrapolation with radio and EUV sources marked. (c) Spatially Resolved Dynamic spectrum for the radio source. (d) GOES data (blue) with spectral averaged radio source light curve (red: full data; black: 20s running mean filtered).
2D Gaussian fitting was done to the images and the spectro-temporal evolution of the source area, integrated flux density and position angle were derived. Fig. 1c shows the evolution of integrated flux density during the flare. Fig. 1d shows the GOES (1-8 Angstrom) light curve with event phases marked. The red curve shows the spectral averaged light curve for the noise storm source. Black curve, obtained by applying a 20s running mean window, brings out the 30s QPPs. M19 had hypothesised that the radio source region could be braided at a dominant scale of ~12 Mm and, magnetic stresses could build up across them and be released via particle acceleration events at the local Alfve’n timescale of 30s. The clumped episodes of type-I bursts within QPP periods could signify this.

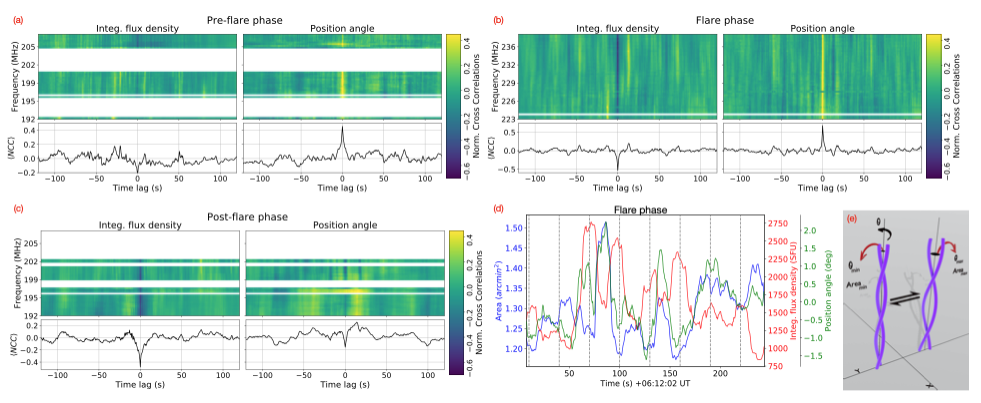
Figure 2 – (a-c): Normalised cross-correlation with respect to area. (d): Frequency averaged evolution of parameters. Vertical lines are marked every 30s (e): “T” mode schematic
The current study discovered simultaneous and often correlated evolution in the area, position angle and intensity of the noise storm source with simultaneous 30s QPPs clearly seen in the running mean filtered light curves (Fig. 2c). To quantify this correlated evolution, a normalised cross correlation (NCC) analysis was done for parameter evolution curves at each observation frequency. Area was chosen as the base parameter for NCC analysis. Fig. 2a-c show the results. The sub-bands with lot of bad parameter estimates are masked. The similarity in NCC across the band could be because it corresponds to less than 10% of the pressure scale height in the regions probed. The mean dynamical properties would hence be similar. The line plots below each panel show the band averaged NCC. Two dominant modes of correlated evolution are discovered: an area and integrated flux density anticorrelated mode (“S”); an area and position angle correlated mode (“T”). Fig. 2e depicts the “T” mode as a winding-unwinding motion of the braid loop. The pre-flare phase shows the dominance of torsional-like “T” mode which gets converted to sausage-like “S” via the flare.
Interpretation
Source area is a proxy to the region illuminated by particle beams, position angle to their overall directionality and integrated flux density to their energy flux. In the pre-flare phase, the braided loop is pumped with free energy mainly in the “T” mode. This is released as particle acceleration events at Alfve’n timescales. In the flare phase, the loop was possibly driven into a critically braided state. This triggered an internal restructuring with a redistribution of excess energy in “T” modes to “S”, and particle energisation. In the post-flare phase, “S” mode becomes dominant in the restructured loop.
Conclusions
The first study of noise storm structural evolution is presented. Source parameters show two dominant modes of correlated evolution: a winding-unwinding like “T” mode; a sausage-like “S” mode. Flare mediates a mode conversion from “T” to “S” accompanied by enhanced particle acceleration and a microflare. This hints at the restructuring of an internally braided loop. Tracing evolutionary modes in the associated noise storm sources could hence be used to track the internal dynamics during flares, irrespective of their energy budget.
*Based on recent paper by Atul Mohan, 2021, ApJL, 901, L1
References
Elgaroy, E.,O., 1977, Solar Noise Storms (Oxford: Pergamon Press)
Li, C. Y., Chen, Y., Wang, B., et al. 2017, SoPh, 292, 82
Mohan, A., McCauley, P.,I., Oberoi, D. & Mastrano, A. 2019a, ApJ, 883, 45
