Drift pairs are a rare and puzzling type of solar radio emission, firstly identified by Roberts (1958). They occur at low frequencies (~10-100 MHz) and look like two parallel frequency-drifting narrow-band stripes separated in time. The drift rates (typically ~2-8 MHz/s) are intermediate between those of type II and type III bursts; both positive and negative frequency drifts are observed. The most enigmatic characteristic of drift pair bursts is that their components are shifted in time rather than in frequency – the second component of a pair looks like a repetition of the first one, delayed typically by 1-2 s. The origin of the drift pair bursts remains unclear, which is caused mainly by the lack of spatially and temporally resolved observations.
Observations and results
On 12 July 2017, the LOw Frequency ARray (LOFAR, van Haarlem et al. 2013) detected a large cluster of drift pair bursts. The observations were made in the low-frequency band between 30 and 70 MHz. A recently published Letter by Kuznetsov & Kontar (2019) reports unique observations that allowed us for the first time to track the evolution of the drifting pair emission sources both at a fixed frequency and along the drifting pairs.
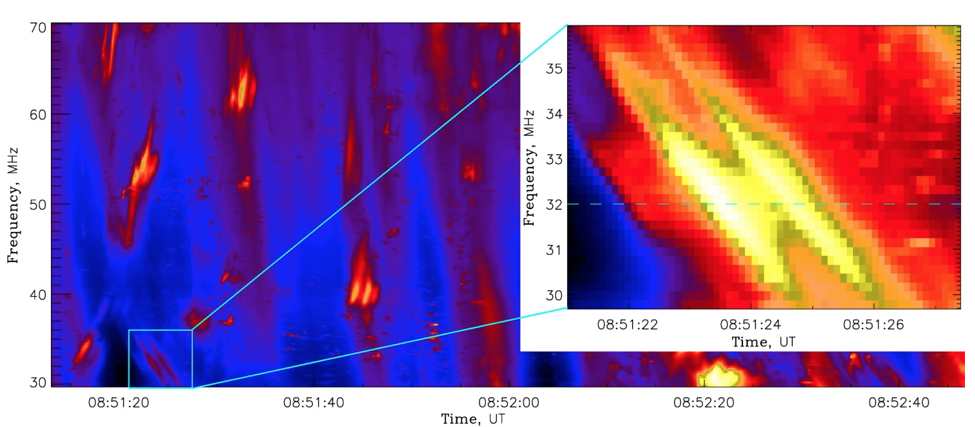 Figure 1 – Dynamic spectrum of solar radio emission recorded with LOFAR on 12 July 2017 with the time and frequency resolution of 0.1 s and 0.2 MHz, respectively. The insert shows enlarged fragment of the dynamic spectrum with one drift pair burst. The figure is adapted from Kuznetsov & Kontar (2019).
Figure 1 represents a fragment of dynamic spectrum containing a solar radio storm with a number of drift pair bursts with both positive and negative frequency drifts, as well as broadband drifting structures resembling type III bursts. No noticeable X-ray or optical flares were detected during the radio burst storm or immediately before it.
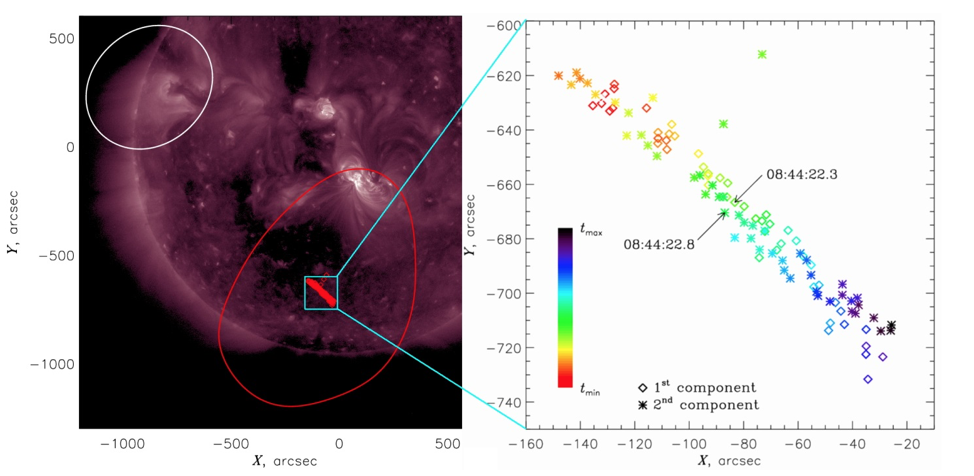 Figure 2 – Left: centroid locations of the emission sources of a typical drift pair burst (with negative drift) at different times and frequencies along the burst components, overplotted on the SDO 211 Å image; red and white contours represent the emission source shape at a fixed time and the LOFAR beam shape at half-maximum level, respectively. Right: enlarged map of the centroid locations; two components of the drift pair are shown by different symbols, while colors from red to violet correspond to increasing time. The figure is adapted from Kuznetsov & Kontar (2019).
Figure 2 explores the spatial evolution of the emission sources in both time and frequency, following the intensity peak of the drifting bursts. The left part of the figure shows the trajectory of the source centroids (determined using Gaussian fitting) projected on the solar disk. The right part of the figure compares the spatial characteristics of two components of the drift pair, which are shown by different symbols, and the times are color-coded. The source centroids of both components evidently propagate in the same (southeast) direction along the same trajectory, although with a certain time delay.
All analyzed drift pair bursts have been found to demonstrate similar behavior: the second component of a pair repeats the characteristics of the first one not only in time, but also in the spatial domain. The bursts with positive and negative frequency drifts are produced in the same regions, but their sources propagate in opposite directions. The visible source velocities vary from ~20 000 km/s up to very high values (~200 000 km/s) which often exceeds the velocities inferred from the drift rate. The visible source sizes (~10′-18′) are more compact than typical type III sources at the same frequencies (Dulk & Suzuki 1980).
Conclusions
The obtained results allow us to rule out some existing models and do not match a simple model of radio echo proposed by Roberts (1958). On the other hand, both the observed source sizes and very high observed source velocities indicate that the emission experiences strong scattering during propagation. The scattering is expected to affect both the time profiles and the apparent source positions of both the direct and the reflected signals, with the visible source located at the distance of the last-scattering surface (Kontar et al. 2019). In such a scenario, the second component spatial expansion and motion at a given frequency would behave similarly to the first component but with a delay, so that each component demonstrates a pattern detected earlier in type IIIb bursts (Kontar et al. 2017). Therefore, the radio-wave turbulent medium propagation model requires further investigation.
Additional info: Based on the recent paper by A.A. Kuznetsov and E.P. Kontar, “First imaging spectroscopy observations of solar drift pair bursts”, Astronomy & Astrophysics Letters, 631, L7 (2019). DOI: 10.1051/0004-6361/201936447
References
Dulk, G.A., Suzuki, S.: 1980, A&A, 88, 203
Kontar, E.P., Chen, X., Chrysaphi, N., et al.: 2019, ApJ, 884, 122
Kontar, E.P., Yu, S., Kuznetsov, A.A., et al.: 2017, Nat. Commun., 8, 1515
Roberts, J.A.: 1958, Aust. J. Phys., 11, 215
van Haarlem, M.P., Wise, M.W., Gunst, A.W., et al.: 2013, A&A, 556, A2