Solar activity is often accompanied by solar radio emission. At low frequencies, radio bursts with short durations of <1 s, known as solar S-bursts, have been identified. These intriguing, low frequency bursts were first identified by McConnell (1982) who named them solar S-bursts, owing to their similarity to Jovian S-bursts: the S stands for short or storm. S-bursts appear as narrow tracks on a dynamic spectrum that usually drift from high to low frequencies, and in rarer cases, from low to high frequencies.
Here, we present complimentary observations from the Ukrainian T-shaped Radio telescope (UTR-2) and the LOw Frequency ARray (LOFAR) which give us new insight into their nature. The exact emission mechanism behind the generation of S-bursts remains a topic of debate, however, they are believed to be emitted at the plasma frequency. There are currently two leading interpretations of S-burst generation that were proposed by Zaitsev & Zlotnik (1986) and Melnik et al. (2010).
The model put forward by Zaitsev & Zlotnik (1986), suggests that plasma waves near the upper hybrid resonance frequency are excited owing to electrons propagating through an anisotropic plasma within a quasihomogeneous magnetic field. These plasma waves are then scattered by thermal ions to produce electromagnetic radiation at the local plasma frequency, fp. More recently, Melnik et al. (2010) proposed a new mechanism of S-burst generation involving beams of particles (electrons or protons) in resonance with right-hand (RH) circularly polarised waves. This takes place against a background of Langmuir turbulence. The RH waves interact with the Langmuir waves to produce radio emission close to the local plasma frequency that we register as S-bursts.
In this work, the spectral properties of over 3000 S-bursts were analysed to test the validity of the proposed emission mechanisms. We present evidence that the model of Melnik et al. (2010) can account for the observed spectral properties of S-bursts. It is shown that S-bursts can provide an alternative method of estimating the coronal magnetic field strength at various altitudes of the solar atmosphere.
Observations & Results
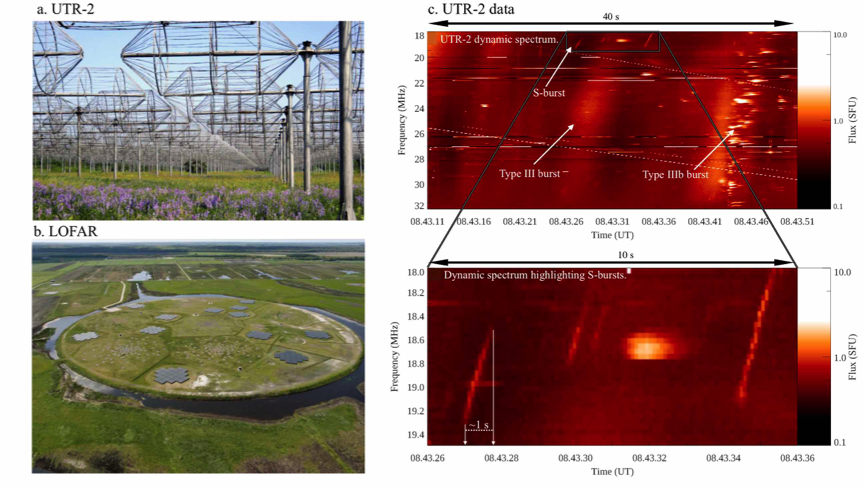
Figure 1 shows images of the instruments used and a sample of our data from UTR-2 that contains S-bursts. The following properties of the bursts were recorded: start time, end time, duration, flux, start frequency, end frequency, bandwidth, drift rate, full-width-half-max duration, and instantaneous bandwidth. S-bursts were found to have short durations of 0.5-0.9 s. For the first time, we show a linear relation between the instantaneous bandwidth and frequency of S-bursts over a wide frequency band, extending the previous result of Melnik et al. (2010). The flux calibration and high sensitivity of UTR-2 enabled measurements of their fluxes, which yielded 11±3 solar flux units (1 SFU ≡ 104 Jy). The source particle velocities of S-bursts were found to be ∼0.07 c.

Figure 1 – Panel (a): Dipole elements that make up UTR-2. UTR-2 consists of 2040 of these dipoles. In the N-S direction, 1440 elements are spread over 240 rows, while 600 elements are spread over the E-W direction giving the telescope a total area of ∼1.4 ×10⁵ m2 (Konovalenko et al. 2016). Panel (b): The heart of the LOFAR core, known as the Superterp (Haarlem et al. 2013). Panel (c): Dynamic spectrum obtained from UTR-2 on 9 July 2013 containing examples of type III, type IIIb, and S-bursts. The highlighted region is shown in greater detail below, indicating the short duration of the bursts (<1 s).
It was found that the model of Zaitsev & Zlotnik (1986) is unable to account for the characteristics of S-bursts that are commonly observed at decametre wavelengths. The bursts modelled by Zaitsev & Zlotnik (1986) represent very narrow-band bursts (<1 MHz) that have central frequencies of ∼254 MHz and total bandwidths that are approximately equal to their instantaneous bandwidths. The model assumes a static source that attributes the frequency drift rate to the electromagnetic wave group delay. However, the S-bursts presented in this work display long lasting saber-shaped features which may extend in frequency by up to 12 MHz (Melnik et al. 2010). Additionally, their total bandwidths are much greater than their instantaneous bandwidths, indicating a dynamic source.
Our observations support for the core assumptions contained within the model of Melnik et al. (2010). For example, the long-lasting sabre shaped structure of S-bursts and their appearance against the background of other types of radio activity (indicating a turbulent atmosphere) were consistent throughout the data. The linear relation between frequency and instantaneous bandwidth provided further support. Additionally, evidence was observed that S-bursts are produced by moving particles, as opposed to the stationary sources proposed by Zaitsev & Zlotnik (1986).
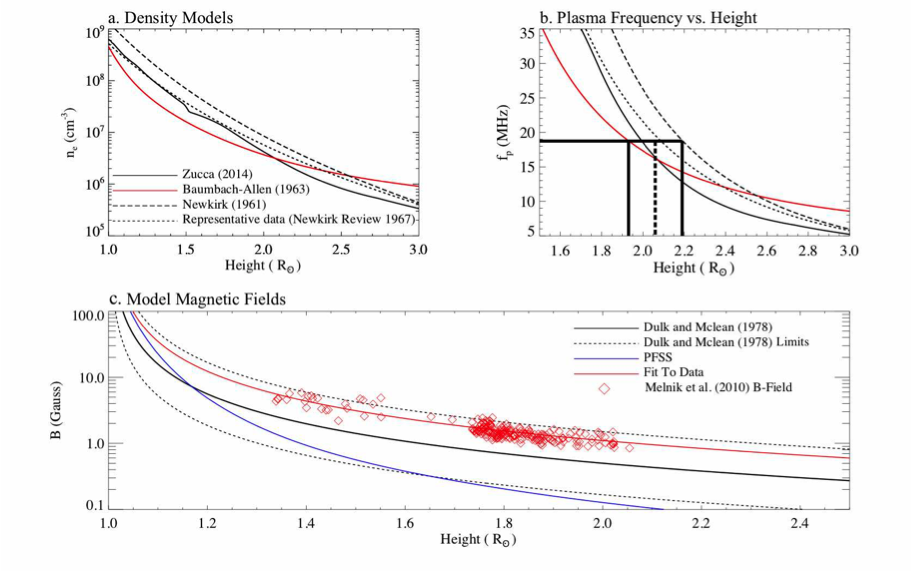
The Melnik et al. (2010) model can enable us to remote sense of the coronal magnetic field. Given that the model assumes emission close to the plasma frequency, we can estimate the source heights for each burst. Figure 2 shows how the plasma frequency varies with height for various density models. Figure 2b gives an example of how we estimated the source height of an S-burst with a frequency of ∼19 MHz. As shown, we calculated a minimum and maximum height and then used the average (dashed line) of these heights as our estimation. Figure 2c shows the magnetic field strengths found using the model of Melnik et al. (2010) at each of the source height estimates. These magnetic field strengths ranged from 0.9-5.8 G between heights of ∼1.3 R⊙ to 2 R⊙.

Figure 2 – Panel (a): Electron density vs. heliocentric height for the various active region electron density models. Panel (b): The plasma frequency vs. heliocentric height for each density model. An example of how we estimated the source height of an S-burst with a frequency of ∼19 MHz is shown. Panel (c): The magnetic field strengths predicted by Melnik et al. (2010) at each of the source height estimates according to our data.
To verify the accuracy of the Melnik et al. (2010) model magnetic field strengths, we compared the magnetic field at 1.02 R⊙ according to a potential field source surface (PFSS) extrapolation with the value found at the same height obtained via the extrapolation of the fitted data. The values were found to be ∼332 G and ∼389 G, respectively. These fields are in good agreement indicating that the fit to the data may provide us with the ability to conduct remote sensing of the coronal magnetic field on the day of the observations.
Conclusions
The spectral properties of S-bursts were measured using UTR-2 and LOFAR. Leading theories of S-burst generation were investigated. It was noted that the model of Zaitsev & Zlotnik (1986) is unable to account for the properties of S-bursts that are commonly observed at decametre wavelengths. It was found that the magnetic field strengths at the source heights of S-bursts ranged from 0.9-5.8 G. This Melnik et al. (2010) model can account for the observed spectral properties of S-bursts and produced magnetic fields that are in good agreement with observations and coronal magnetic field models.
References
Konovalenko, A., Sodin, L., Zakharenko, V., et al. 2016, Exp. Astron., 42, 11
McLean, D. J. D., Dulk, G. A. G., & McLean, D. J. D. 1978, Sol. Phys., 57, 51 279
McConnell, D. 1982, Sol. Phys., 78, 253
Melnik, V. N., Konovalenko, A. A., Rucker, H. O., et al. 2010, Sol. Phys., 264, 53 103
Newkirk, Jr., G. 1961, ApJ, 133, 983
Newkirk, Jr., G. 1967, Annu. Rev. Astron. Astrophys., 5, 213
Zaitsev, V. V., & Zlotnik, E. Y. 1986, Sov. Astron. Lett., 12, 311
Zucca, P., Carley, E. P., Bloomfield, D. S., et al. 2014, A&A, 564, A47
Based on: Brendan P. Clarke et al., 2019, A&A, 622, A204
*Full list of authors: Brendan P. Clarke, Diana E. Morosan, Peter T. Gallagher, Vladimir V. Dorovskyy, Alexander A. Konovalenko, & Eoin P. Carley
Acknowledgement: We thank the Solar team from the Institute of Radio Astronomy of the National Academy of Sciences of Ukraine for conducting observations and providing the original data from the UTR-2 radio telescope. The team is composed of Dr. A. Stanislavsky, Dr. A. Koval, Dr. M. Shevchuk, and Dr. A. Boiko.
