The improved sensitivity provided by new-generation radio arrays has unveiled an enormous diversity of previously under-appreciated solar radio bursts. Observations in the 100-240 MHz band using the Murchison Widefield Array (MWA) have highlighted the presence of a myriad of weak, short-lived, narrow-band solar emission features (Fig. 1), even during calm solar periods. Their appearance in the MWA solar dynamic spectrum (DS) comes closest to miniature versions of type-III bursts with bandwidths and durations of order a few MHz and a second respectively. Their high occurrence rates (many thousands per hour in DS bandwidth) raise the possibility that they might be radio signatures of the widely-discussed nanoflares, expected to be responsible for coronal heating.
Since such features have been discovered only comparatively recently (Oberoi et al. 2011), their detailed observational characteristics in terms of their morphology in the DS and flux density are yet to be established. A statistical characterization of their properties is needed to understand them and evaluate their potential contribution towards coronal heating. However, their seemingly ubiquitous presence necessitates the use of an automated approach. Here, we employ an automated wavelet-based technique, which we have developed, for robust feature detection and characterization.
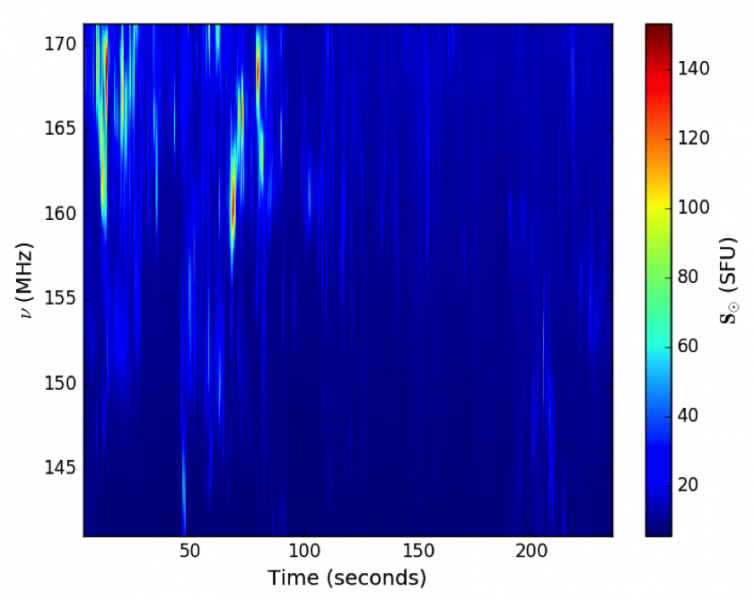 Figure 1. A sample flux-calibrated MWA solar dynamic spectrum corrected for instrumental artifacts. The features of interest appear as short-lived, narrow-band vertical streaks, showing no perceivable frequency drift, in the time-frequency plane.
Observations and Processing
The MWA data analyzed in this work were collected on 31st August 2014 between 00:32:00 and 06:56:00 UTC, a period marked by moderate solar activity levels (http://www.solarmonitor.org/). We find that the features of interest ride on a spectrally varying broadband background continuum. To distinguish between feature and continuum properties, we first subtract out the background flux density, determined using a Gaussian Mixtures Model. Continuous wavelet transform is then employed to filter out features of varying axial ratios (~10-50). To best fit the unimodal nature of their spectral and temporal profiles, we use a variable-separable 2D Ricker (aka Mexican Hat) wavelet as the mother wavelet. By serving as a peak and support detection filter, the Ricker wavelet provides us with robust estimates of feature properties – bandwidths ($\Delta \nu$), durations ($\Delta t$), peak flux densities ($S_{\odot,F}$) and peak frequencies ($\nu$).
Though we have tuned our wavelet-based algorithm for the MWA, the technique itself is general and can be applied to other instruments. As we enter a regime where the new-generation instruments generate enormous quantities of information-rich data, the extraction of physics from these voluminous data is expected to increasingly rely on automated techniques like the one presented here.
Results and Discussion
The distribution of peak flux densities (Fig. 2a) of features spans three orders of magnitude, from 0.6 to 307 SFU. The weakest detected features here are nearly 1.6 times weaker than the type-I bursts investigated by Ramesh et al. (2013) and are among the weakest radio bursts reported to date in the literature.
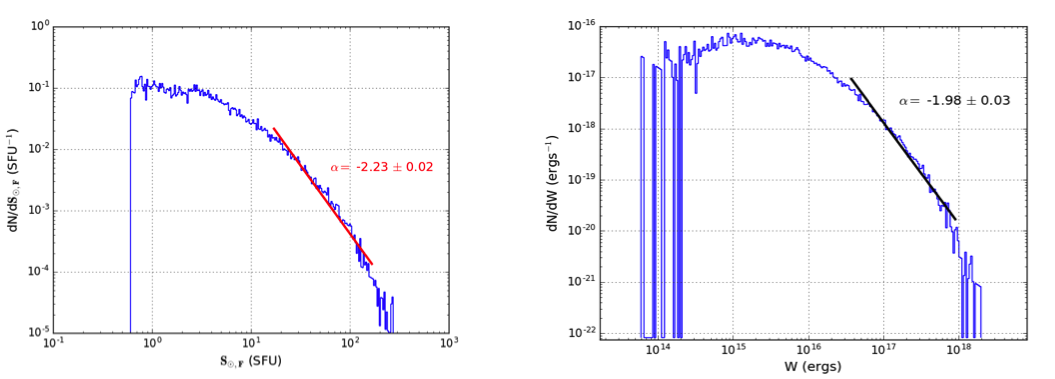 Figure 2. Histograms of (a) peak flux densities and (b) radiated feature energies.
For weak flare emissions to contribute significantly to coronal and chromospheric heating, Hudson H.S. (1991) has shown that the power-law ($dN/d\mathcal{W} \propto \mathcal{W}^{\alpha}$) index of flare energies ($\mathcal{W}$) must be lower than -2. The histogram in Fig. 2a is incomplete below $\sim$ 10 SFU and is limited by statistics above $\sim$ 160 SFU. A power-law fit to an intermediate range of flux densities, where we expect this distribution to be complete, yields an $\alpha = -2.23 \leq -2$, implying that these features could potentially contribute to coronal heating.
Assuming isotropic emission and constant flux density within a feature profile, the radiated feature energy (W) is estimated using $W = 4\pi D^2 S_{\odot,F}\Delta t \Delta \nu$ where $D$ = 1 AU. Figure 2b shows the histogram of feature energies, which typically lie within $10^{15}-10^{18}$ erg. A power-law fit to this distribution returns an $\alpha = -1.98$. Within the uncertainty of the fit, this again satisfies Hudson’s criterion, suggesting the possibility of these features contributing to coronal heating.
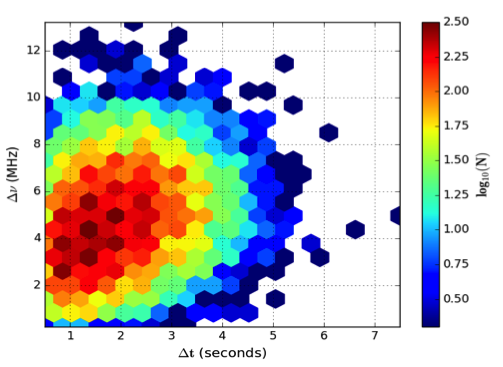 Figure 3. 2D histogram showing distributions of feature bandwidths and durations
Figure 3 depicts a 2D histogram of $\Delta \nu$ and $\Delta t$ of these features. These distributions form a unimodal cluster with peak at about 4-5 MHz and about 1-2 s, close to the typical bandwidths and durations reported for type-I bursts respectively.
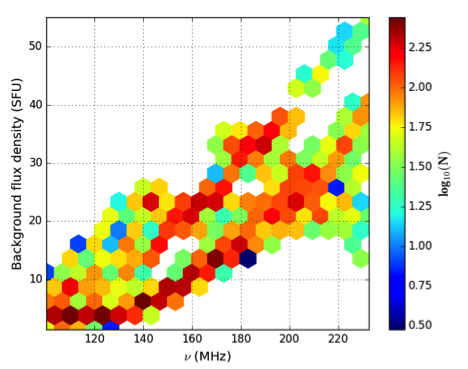 Figure 4. 2D histogram showing the variation of the background flux density at the location of a feature as a function of the feature peak frequency.
Figure 4 shows a 2D histogram of the background flux density at the location of a feature as a function of the corresponding feature peak frequency. The background continuum displays the expected monotonically increasing spectral trend due to the thermal quiet-Sun emission. However, at any frequency, the background flux density is observed to vary by a factor of ~2. Such large-scale spectral changes in the background flux density over a time scale of 30 minutes are not expected of the quiet-Sun emission. This indicates that the background must be enhanced by another rapidly varying continuum. The presence of this additional continuum emission suggests that, though these features are weaker than conventional type-I bursts, they correspond to the brighter emissions in a weak type-I storm. The time-varying component of the continuum can plausibly come from an ensemble of weaker features which remain unresolved in our data.
Summary and Conclusion
Numerous weak (0.6 – 307 SFU), narrowband (4-5 MHz), short-lived (1-2 s) emission features have been detected in high-sensitivity MWA solar observations. They possess typical radiated energies of about $10^{15}-10^{18}$ erg and are among the weakest solar radio bursts reported to date in the literature. The distribution of their energies obeys a power-law with index less than -2. They, hence, satisfy Hudson’s criterion and can potentially contribute to coronal and chromospheric heating. Concerning their place in the popular classification of metric solar radio bursts, these features might likely be weak type-I bursts.
*Full list of authors: A. Suresh, R. Sharma, D. Oberoi, S. B. Das, V. Pankratius, B. Timar, C. J. Lonsdale, J. D. Bowman, F. Briggs, R. J. Cappallo, B. E. Corey, A. A. Deshpande, D. Emrich, R. Goeke, L. J. Greenhill, B. J. Hazelton, M. Johnston-Hollitt, D. L. Kaplan, J. C. Kasper, E. Kratzenberg, M. J. Lynch, S. R. McWhirter, D. A. Mitchell, M. F. Morales, E. Morgan, S. M. Ord, T. Prabu, A. E. E. Rogers, A. Roshi, N. Udaya Shankar, K. S. Srivani, R. Subrahmanyan, S. J. Tingay, M. Waterson, R. B. Wayth, R. L. Webster, A. R. Whitney, A. Williams & C. L. Williams
Based on a recently published article:
Suresh et al. (2017). Wavelet-based Characterization of Small-Scale Solar Emission Features at Low Radio Frequencies, The Astrophysical Journal, 843 (19). DOI: 10.3847/1538-4357/aa774a
References:
Hudson, H.S., Solar Physics, 133 p. 357, 1991.
Oberoi, D. et al., The Astrophysical Journal Letters, 728, p. L27, 2011.
Ramesh, R. et al., The Astrophysical Journal, 762, p. 89, 2013.