The quiet Sun coronal emission dominantly comes from thermal bremsstrahlung. As this radiation traverses the coronal medium on its way to the Earthbound observer, the coronal optical depth, τ, along typical ray paths is neither low enough to be approximated as optically thin, nor high enough to be treated as optically thick. On its way to the observer, it gets modified substantially due to propagation effects —primarily refraction and scattering—through the magnetized and turbulent coronal medium, leading to the redistribution of the intensity in the image plane.
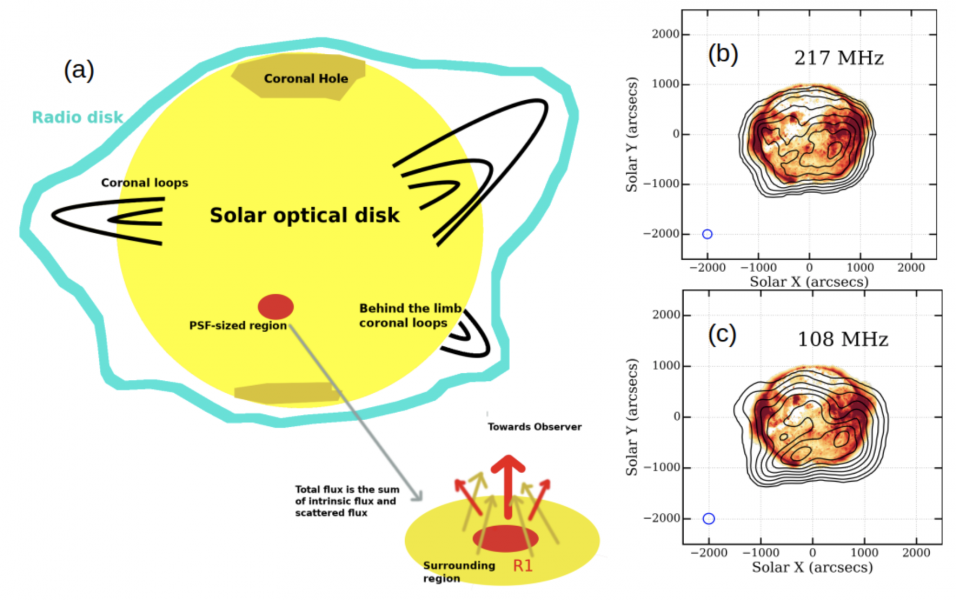 Figure 1 – Panel (a): Schematic showing the features of the radio Sun and the presence of scattered flux in a PSF-sized region from its surrounding regions. The red region represents region R1. The total flux within a PSF-sized region is the sum of its intrinsic flux (red arrow) and the scattered flux (yellow arrows). Panel (b) & (c): AIA 193 Å EUV map along with MWA solar contours at 108 MHz and 217 MHz. The 9 Contour levels are at 25%, 35%, 45%, 55%, 65%, 75%, 85% and 95% level w.r.t the image maximum.
By studying the differences in the observed quiet Sun maps with thermal bremsstrahlung models, we can quantify the effect of scattering and derive some of the scattering parameters. We compare high-quality solar radio images from an exceptionally quiet period with the corresponding thermal bremsstrahlung maps obtained using data-driven MHD simulations. The radio images come from the Murchison Widefield Array (MWA), which represents the state of the art in solar imaging in this band (Mondal et al. 2019, 2020a, 2020b; Mohan et al. 2019a, 2019b). The corresponding simulated thermal bremsstrahlung maps are obtained using the FORWARD software (Gibson et al. 2015 ,Gibson et al. 2016), which models the radio brightness distribution (TB ).
Interesting Radio-EUV features at meterwavelengths
At the higher frequency end of our observations, the large-scale correspondence between the EUV and radio emissions is seen (217 MHz MWA map, Figure 1). The EUV bright regions also tend to have regions of higher TB nearby. The large coronal hole, occupying much of the northern hemisphere, is clearly seen in the EUV with a thin tongue dipping into the southern hemisphere. At 217 MHz, the coronal hole region is associated with lower TB, though by 108 MHz, the same region has higher TB values than its neighboring regions. In fact, at 108 MHz, the enhanced TB sits atop the thin coronal hole tongue (108 MHz MWA map, Figure 1).
Thermal Bremsstrahlung model
The thermal bremsstrahlung emission depends directly on the local plasma parameters like electron density, temperature, and the local magnetic field. For thermal bremsstrahlung, which is always included in a FORWARD radio emission calculation, opacity results from collisions between electrons and ions. However, FORWARD does not incorporate any propagation effects, i.e., it does not take into account the scattering and refraction caused by the coronal density structures that are a part of the PSIMAS model or the refraction due to the large-scale density decrease with coronal height.
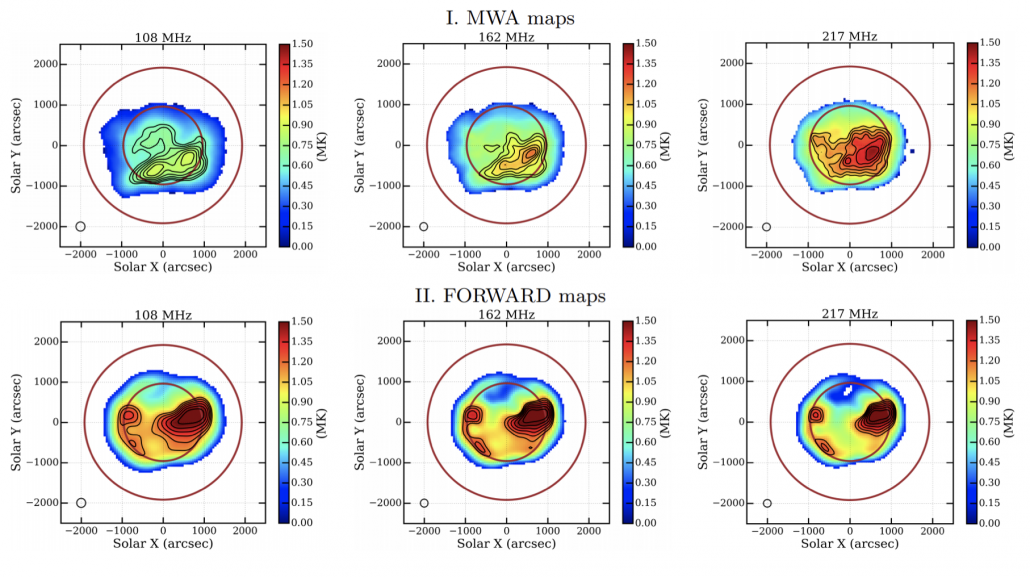 Figure 2 – Top panel: Averaged brightness temperature solar maps for three MWA frequency bands at 108, 162 and 217 MHz. The maps, which these are the average of, were made with frequency and time averaging of 2 MHz and 0.5 seconds, respectively. Middle panel: FORWARD brightness temperature solar maps for three frequency bands at 109, 162 and 217 MHz. Note that only TB > 0.2 MK are shown. Circles mark 1 and 2 R. Contour levels in all the maps are at 70, 75, 80, 85, 90 and 95 % of the peak. The peak MWA TB for 108, 162 and 217 MHz are 0.92, 1.20 and 1.50 MK, while for FORWARD maps peak TB are 1.59, 1.60 and 1.61 MK respectively.
Comparison of FORWARD and MWA maps
We find a good agreement between them at highest two frequencies at 217 MHz and 240 MHz, but below 200 MHz FORWARD overestimates the flux densities. For 217 and 240 MHz, assuming FORWARD models to be true representations of solar emission, we obtain a lower limit on the fraction of scattered emission. We find smallest fraction of 14% for AR, and the largest is 300% at the same frequency for coronal hole at 217 MHz. Large values for quiet Sun and coronal hole regions imply that scattering/refraction plays an important role in redistributing the flux density. We further quantify impacts of propagation due to the estimated level of inhomogeneities in the coronal medium. The strength of scattering is well known to depend on the level of density inhomogeneities, parameterized by ε = ΔN N, where N is the local average electron density and ΔN is a measure of the departure from it. We assume that the inhomogeneities have a Gaussian distribution with a characteristic correlation length scale h (Chandrasekhar 1952; Hollweg 1968; Steinberg et al. 1971; Chrysaphi, N. et al. 2018; Kontar et al. 2019). For the disk center, we compute the optical depth due to scattering using FORWARD modelled densities and temperature for a range of values for ε2/h. These optical depth values were fed into radiative transfer equations and optimised for the observed MWA brightness temperature of the disk center.
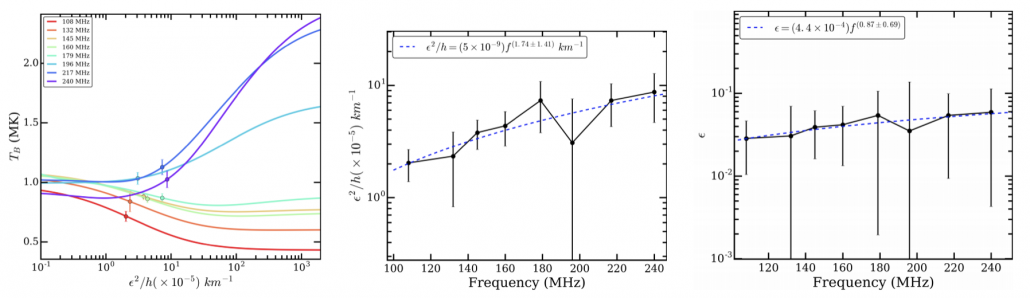 Figure 3 – Left panel: The brightness temperature obtained by radiative transfer for disk-centre LoS by varying ε2/h. The points on the curve are the MWA TB for disk-centre LoS. Middle panel: The optimised values of ε2/h for MWA frequency bands. The errorbars are the propagated uncertainties in MWA fluxes to brightness temperatures and ε2/h. The dashed line shows the power-law fit. Right panel: The optimised values of for MWA frequency bands. Note that here h ≈ 40 km. The dashed line shows the power-law fit to the datapoints.
Conclusions
Scattering and refractive effects redistribute the radio emission on the solar disk, significantly, changing the appearance of the radio Sun (e.g., Aubier et al. 1971; Rahman et al. 2019; Kontar et al. 2019). The peak of the emission associated with the active regions shifts by 8–11ʹ between the observed and modeled maps closer to the disk-center, but in non-radial direction (Figure 2). Coronal refraction tends to shift sources closer to the disk center, while scattering not only increases the apparent observed size, it also tends to shift the apparent location of sources farther from the disk center. Anisotropic scattering from nonradial coronal structures can give rise to nonradial shifts in the apparent locations of sources. The angular size of the Sun in MWA images is also found to be larger than that in FORWARD images by 25–30%.
We estimate that for coronal holes, the observed TB could be dominated by a factor between 2 and 3 by the radiation which has been scattered into these lines of sight from the neighboring regions; while for active regions, up to half of the flux density might be scattered out of these lines of sight. Thus, the observed TB depends not only on the intrinsic TB of the region from where the radiation is originating, but also on the TB of the neighboring regions (Figure 1a). Recently, ubiquitous impulsive emissions of flux densities down to ∼mSFU levels have been reported (Mondal et al. 2020a). In this context, we note that the significant smearing in the image caused by scattering will make it harder to detect intrinsically low-level variations in solar radio images.
The coronal density inhomogeneities arise due to turbulence, and it is interesting to quantify the level of density fluctuations. We estimate an average inhomogeneity parameter ε2/h towards
the central LoS to be (4.9±2.4)×10-5 km-1(Figure 3). Using h = 40 km (Steinberg et al. 1971) leads to an average value of ε = (4.28±1.09)%, which is consistent with earlier estimates (Figure 3). Variations in the estimated values of ε could reflect the diversity of coronal physical conditions. The coronal inhomogeneities observed close to the Sun advect away into the solar wind and evolve. Recently, in-situ measurements by the Parker Solar Probe have yielded ε≈6–7% (Krupar et al. 2020), implying that ε has not evolved significantly even out to much larger solar distances.
Additional info: Based on the recent paper by Sharma, R. & Oberoi, D., “Propagation Effects in Quiet Sun Observations at Meter Wavelengths”, ApJ, 903, 2 (2020). DOI: 10.3847/1538-4357/abb949
References
Aubier, M., Leblanc, Y., & Boischot, A. 1971, A&A, 12, 435
Chandrasekhar, S. 1952, MNRAS, 112, 475
Chrysaphi, N., Kontar, E. P., Holman, G. D., & Temmer, M. 2018, ApJ, 868, 79
Gibson, S. 2015, in IAU Symp. 305, Polarimetry, ed. K. N. Nagendra et al., 245, doi:10.1017/S1743921315004846
Gibson, S., Kucera, T., White, S., et al. 2016, FrASS, 3, 8
Hollweg, J. V. 1968, AJ, 73, 972
Kontar, E. P., Chen, X., Chrysaphi, N., et al. 2019, ApJ, 884, 122
Krupar, V., Szabo, A., Maksimovic, M., et al. 2020, ApJS, 246, 57
Mohan, A., McCauley, P. I., Oberoi, D., & Mastrano, A. 2019a, ApJ, 883, 45
Mohan, A., Mondal, S., Oberoi, D., & Lonsdale, C. J. 2019b, ApJ, 875, 98
Mondal, S., Mohan, A., Oberoi, D., et al. 2019, ApJ, 875, 97
Mondal, S., Oberoi, D., & Mohan, A. 2020a, ApJL, 895, L39
Mondal, S., Oberoi, D., & Vourlidas, A. 2020b, ApJ, 893, 28
Rahman, M. M., McCauley, P. I., & Cairns, I. H. 2019, SoPh, 294, 7
Steinberg, J. L., Aubier-Giraud, M., Leblanc, Y., & Boischot, A. 1971, A&A, 10, 362
Thejappa, G., & Kundu, M. R. 1994, SoPh, 149, 31
Thejappa, G., & MacDowall, R. J. 2008, ApJ, 676, 1338