Large solar flares are well known sites of prodigious particle acceleration. While these have deservedly attracted considerable attention, small episodes of electron acceleration and heating have been lately recognized as possible candidates for heating the quiet solar corona. We study the number, power and energy carried by nonthermal electrons produced by instances of small scale electron acceleration in the solar corona.
Our primary focus is on small electron acceleration events in the corona that are associated with impulsive electron events observed in situ at 1 AU by the EPAM detector aboard the ACE spacecraft. We carried out an extensive survey using ACE/EPAM data spanning 2004-2015, which covered the maxima of solar cycles 23 and 24 and the intervening minimum. We only study such impulsive electron events that are
- not associated with large GOES soft X-ray flares greater than C1, or with CMEs
- are associated with IP type III bursts, and
- are associated with reliable west limb signatures in RHESSI HXR images
We found 18 events matching the first two criteria, but the unavailability of reliable RHESSI HXR signatures below 25 keV limited our final shortlist to six events.
Following Krucker et al we calculate the event onset time $t_{sun}$ via,
\[ t_{1AU} = t_{sun} + \frac{L}{v(E)}\,, \tag{1}\]
where $L$ is the path length (taken to be equal to the average Parker spiral length of $1.2$ AU), and $v(E)$ is the particle speed corresponding to the average energy of the appropriate ACE/EPAM channel.
The four main steps involved in shortlisting are shown in Figure 1 for a representative event. Due to the weak nature of the event we don’t see many counts above 50 keV in RHESSI data. We see a small enhancement in the SXR flux, although the level is well below C class. The final shortlisted events are listed in Table 1.
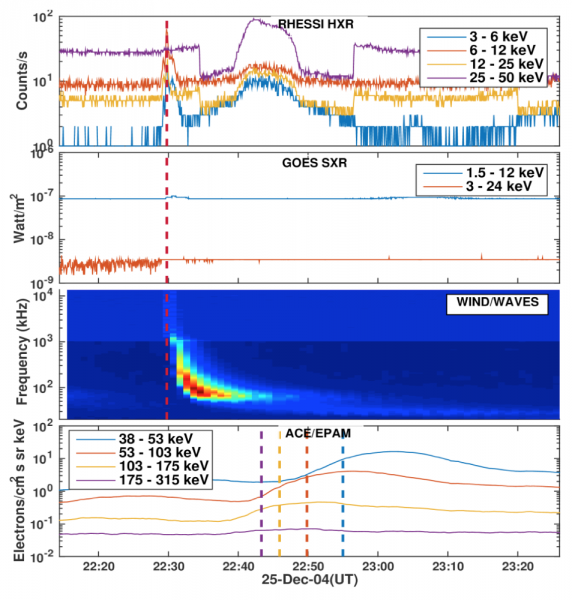 Figure 1. Shows the event selection process for the second event on Dec 25 2004. The top panel is the RHESSI HXR data. The thick red dashed line is the event onset time computed using Eq(1). The second panel shows GOES SXR data. The third panel shows data from WIND/WAVES instrument. The last panel shows in-situ electron data from ACE/EPAM. The dashed lines show expected arrival times of electrons corresponding to each channel.
Data Analysis
The peak flux in each channel recorded at the mean energy of each ACE/EPAM energy channel could be represented as a differential energy spectrum
\[ F(E) = F_{0} (E_{0}/E)^{\delta_{1AU}}\,, \tag{2}\]
where $\delta_{1AU}$ is the spectral index of electrons escaping the coronal acceleration site and detected in situ at 1 AU by ACE/EPAM. This is different from $\delta_{hxr}$ determined for electrons at the acceleration site using spectral RHESSI data, using a thick target fit. The photon spectral index $\gamma$ was obtained by fitting a broken power law (Fig 2). All these quantities are listed in Table 1. If the electrons that escaped were from the same population at the acceleration site we would expect similar spectral index for both. Datlowe & Lin (1973) noted that a thick target model for HXR emission gives $\delta_{1AU} = \gamma +1 $.
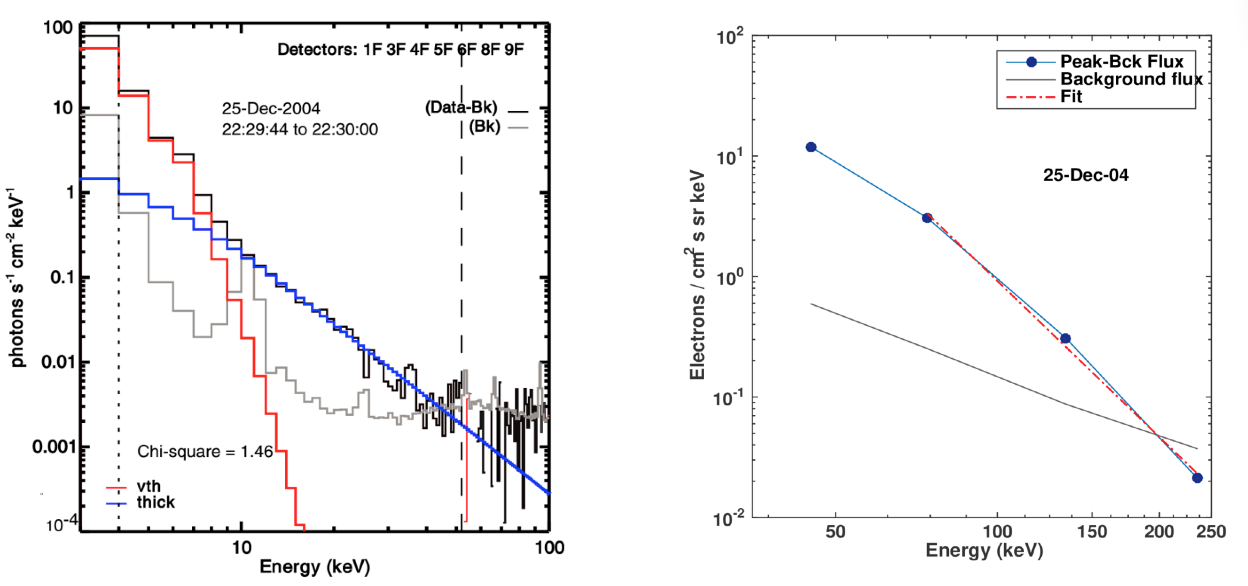
Figure 2: The energy spectrum fits for escaping electrons detected by ACE/EPAM (right) and the HXR energy spectrum from RHESSI (left) for the second event on Dec 25 2004. The escaping electrons show a break in energy at 74 keV. For the RHESSI spectrum we limit the fit to range of energies with count above background spectrum.
We find that the photon spectral index $\gamma$ and the electron spectral index $\delta_{1AU}$ follow this relation with a correlation coefficient of 0.86.
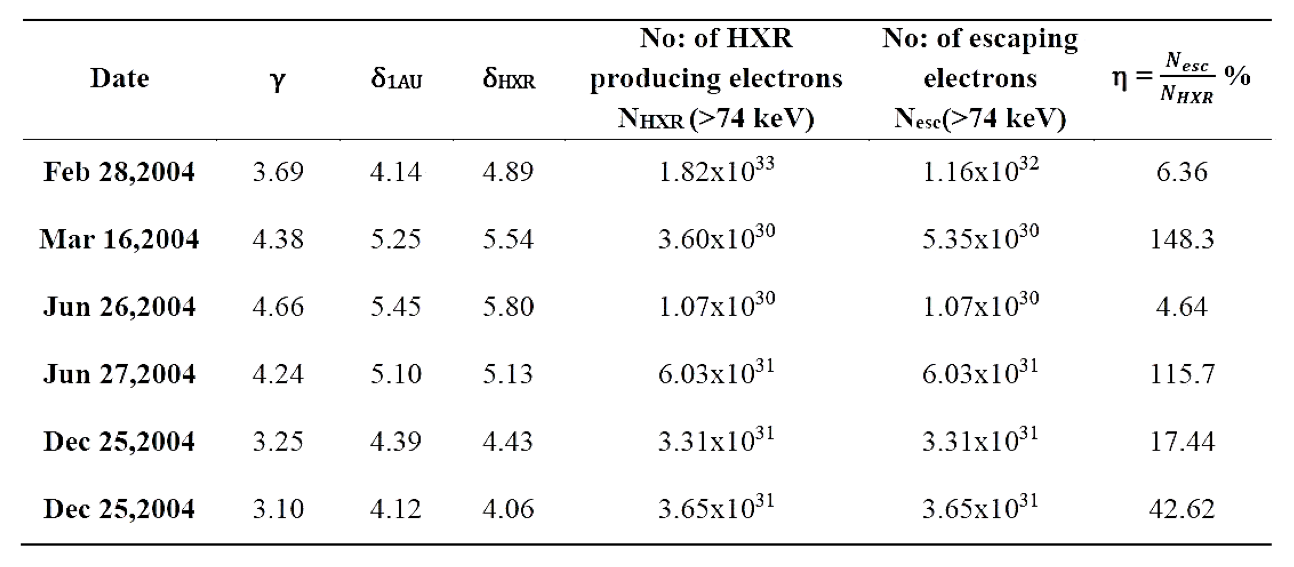 Table 1: Spectral characteristics and number statistics for electrons escaping and electrons at the acceleration site. $\delta_{1AU}$ and $\delta_{hxr}$ denote the energy spectrum power law indices for escaping electrons and the electrons at the acceleration site respectively. The escaping fraction gives an idea about the fraction of electrons escaping from the acceleration site compared to the number precipitating downwards to produce HXR. This number is usually 0.1-0.01 for bigger flares, while they are much larger in our case.
We observe a break in the electron spectrum at 74 keV. By contrast, the break energy for larger flares tends to be around 48 keV (Fig 2). From Eq (2) the number of electrons escaping and the energy carried away by these escaping electrons can be estimated by finding the first and second moments of the distribution. Similar numbers are calculated for electrons in the acceleration site using the distribution found using RHESSI data. However since these numbers were calculated only for energies above 74 keV for escaping electrons, we scale the corresponding number of HXR electrons above 74 keV. These quantities are listed in Table 1 and 2.
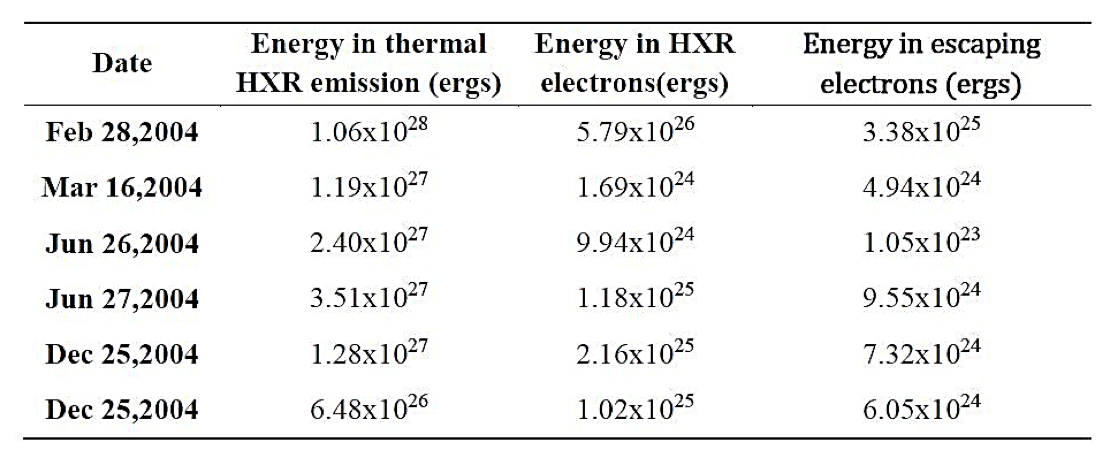 Table 2: Energy statistics for electrons escaping and the electrons in the acceleration site. The thermal energy was determined by multiplying the source size with the emission measure and temperature. The energy contained in HXR producing electrons are only an order of magnitude higher than that in escaping electrons.
Discussion and Summary
We have investigated the energy budgets and number statistics involved in small electron acceleration events in the solar corona. We concentrate on events that have detectable HXR emission near the west limb and are not associated with flares or CMEs. We also require that they be associated with IP type III bursts and impulsive electron spikes observed in situ at 1 AU.
The events we have shortlisted seem like smaller counterparts of the cold and tenuous flares reported by Fleishman et al (2011). The power law indices for escaping electron population and those at the acceleration site are similar, indicating a common coronal origin. We observe that the ratio of escaping electrons to the number of downward precipitating HXR producing electrons range from 6 per cent to a number as large as 148 percent (Table 1). By comparison, corresponding numbers for larger flares are only around $0.2\%$ (Krucker et al 2007). The total energy contained in electrons detected at 1 AU ranges from $ \sim 10^{23}$ to $10^{25}$ ergs while that containing in the ones producing HXR emission ranges from $ \sim 10^{24}$ to $10^{26}$ ergs (Table 2).
Based on the article: T. James, P. Subramanian, E. P. Kontar, Small electron acceleration episodes in the solar corona, Monthly Notices of the Royal Astronomical Society, Volume 471, Issue 1, 2017, pages 89–99. DOI: 10.1093/mnras/stx1460, arXiv:1706.04031
References:
Simnett G. M., 2005, Solar Physics, 229, 213
Fleishman G. D., et al, 2011, The Astrophysical Journal, 731, L19
Krucker S., et al, 2007, ApJ, 663, L109
Datlowe D. W., Lin R. P., 1973, Solar Physics, 32, 459
*Full list of authors: Tomin James, Prasad Subramanian, and Eduard P. Kontar