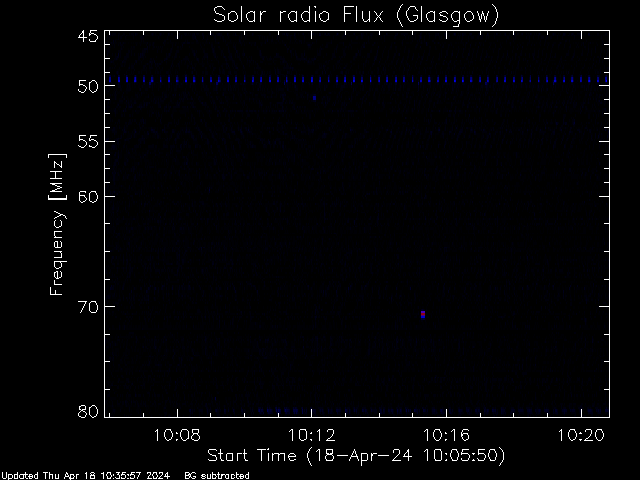
A CALLISTO spectrometer has recently been installed at our Acre Rd Observatory and provides live observations of the Sun at radio frequencies between 45 and 870 MHz with 0.25 second cadence. The first light observations happened on October 10, 2012 and the dynamic spectra of Type III burst can be seen here.
The live data (below) is updated every 15 minutes between 07:15 UT and 17:15 UT.

All times in the graphs are UT. Solar radio data (and all quick look images) from Glasgow CALLISTO spectrometer can be downloaded by either ftp, html. The data from e-Callisto network (including Glasgow) can accessed via the CALLISTO data browser.
To analyse and plot the data, use IDL based solar software SSW with ‘radio’ package required (documentation is available here). As an example, one can use this simple code
IDL> radio_spectro_fits_read,’GLASGOW_20121010_103245_59.fit’,data,time,freq
IDL> loadct,1
IDL> spectro_plot,data,time,freq
; plots the raw data
IDL> spectro_plot,data,time,freq,/xs,/ys,charsize=1.5,title=’Glasgow CALLISTO’,$
ytitle=’Frequency [MHz]’,yr=[400,45],ytickv=[400,300,200,150,100,45],$
yticks=5,yminor=4,xrange=’2012-oct-10 ‘+[’10:45:20′,’10:47:20’]
; plots a shorter frequency/time interval
IDL> data_bg = constbacksub(data,/auto)
; subtracts background
IDL> spectro_plot,data_bg,time,freq,/xs,/ys,charsize=1.5,title=’Glasgow CALLISTO’,$
ytitle=’Frequency [MHz]’,yr=[400,45],ytickv=[400,300,200,150,100,45],$
yticks=5,yminor=4,xrange=’2012-oct-10 ‘+[’10:45:20′,’10:47:20’]
; plots bg subtracted data
IDL> x2jpeg,’Glasgow_1st_light.jpg’
; saves jpeg graph