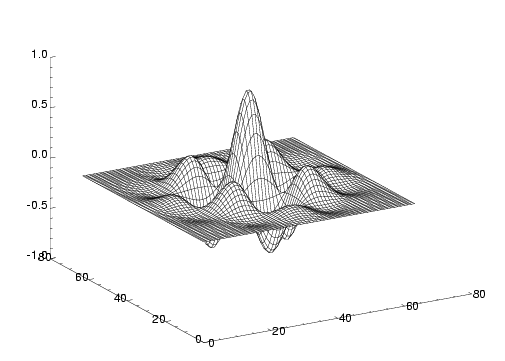
File gausssine.dat, displayed with IDL
IDL is much more powerful and flexible than gnuplot, and has a correspondingly longer learning curve. It's never been accused of being elegant, but with only a bit of headbanging, I've always managed to get it to do what I wanted (I've always seen it as reminiscent of Fortran in this respect).
Several missions have used IDL as the language in which they have written their data-analysis software, and Starlink is currently experimenting with providing IDL interfaces to important Starlink applications, which is possible because IDL can link to codes written in languages such as Fortran or C. IDL is moving towards being a core facility at Starlink sites.
IDL displays data in arrays as part of a generic set of array
manipulations. For example, the data in the file
gausssine.dat was produced by the following
sequence of IDL commands:
The functionx=(findgen(64)-32)^2 d=fltarr(64,64) for i=0,63 do d(i,*)=sqrt(x+(i-32)^2) a3=exp(-(d/15)^2) s=sin(findgen(64)/63*5*3.141592657) s2=s#s m=s2*a3
findgen(N) returns a float array
(indexed from 0 to fltarr declares an array of floats
of the specified dimensions; the array reference
d(i,*) refers to the entire i'th
row of d; the operator # forms
the direct product of the two vectors. The result of this
is to set d to be an array where each element
is the euclidean distance from element
(32,32)[Note 11].Once we have the data in the array m, we can
produce a surface plot with surface,m, and
then go on to annotate it, rotate it, shade it, contour
it, with the large collection of options and parameters to
the surface command. We can produce
PostScript output with the following sequence of commands:
  !p.font=0             ; use postscript fonts rather than IDL outlines
  set_plot, 'ps'        ; use the postscript output driver
  device, /encap, filename='gausssine-idl.eps'
                        ; produce encapsulated postscript
  surface, m
  device, /close        ; close the file
 |
| Figure 2: File gausssine.dat, displayed with IDL |
IDL comes with rather good manuals, the reference parts
of which are available on-line by typing ? at
the IDL prompt.
See appendix B of SUN/55 for a description of how to import data in the Starlink NDF format into IDL.