Gnuplot is valuable because it's so simple -- easy things can be done easily. If you want to graph an equation or plot some data, and produce postscript output, then you'll probably do it faster, from a standing start, than someone using one of the beefier packages. Its weaknesses are that it can't easily do very complicated or fancy visualisations (that is, it doesn't try to take over the world), and it deals naturally only with ASCII data in columns. It is scriptable, but I wouldn't fancy programming anything complicated with it.
Start it up with the simple command gnuplot.
Once it's started, you can give it commands as simple as
to produce a plot of the sine function with default ranges, or you can give it a range and specify a line type as followsgnuplot> plot sin(x)
gnuplot> plot [x=0:3.14] sin(x)*cos(x**2)**2 with impulses
Gnuplot can also graph data files. The example file
gausssine.dat consists of two columns of ![]() values. It can be
plotted in gnuplot with the commands:
values. It can be
plotted in gnuplot with the commands:
This produces the EPS file shown in Figure 1. The file has a blank line after each block of 64 numbers. Gnuplot interprets this as a signal that this is the end of a `row' of a matrix (a standard gnuplot gotcha is that is must be a completely blank line, with no whitespace). You can plot the surface represented by the second column, with the clausegnuplot> set output 'gausssine-gnuplot.eps' gnuplot> set terminal postscript eps Terminal type set to 'postscript' Options are 'eps monochrome dashed "Helvetica" 14' gnuplot> splot 'gausssine.dat' using 1 with lines gnuplot> set terminal x11 # set the terminal type back to the (default) X gnuplot> set output # close the output file
using 2 to
splot. Gnuplot can read more generally
formatted data, but that's already stepping towards
advanced usage.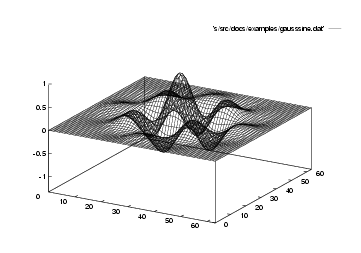 |
| Figure 1: File gausssine.dat, displayed with gnuplot |
There is good help within gnuplot, available by typing
help.