One of the key uses of ESP is for profiling images of galaxies. The ESP application for doing this is ELLPRO. If we again assume we are logged on and that the esp command has been issued, then the following is a simple session using it. The example assumes also, that the kappa command has been issued allowing use of the DISPLAY routine. For the simplest use of ELLPRO, the image containing the galaxy to be profiled needs to be displayed.
The first instruction clears the X window and displays the NDF image file ic3374c. The second instruction defines the colour table to be employed for that window.% display in=ic3374c mode=faint device=xw % lutgrey device=xw
The next step is to start up ELLPRO and give it information about how you wish to work.
Choosing a value of TRUE for MODE tells the program that you will either be typing in a value for the location of the galaxy centre on the image or using a cursor to indicate where it is. The alternative is for the program to read in a list of co-ordinates from a text file. Specifying a value of TRUE for CURSOR then tells the program that you will be inputting the location by using a cursor. This is only possible if you have previously displayed an image on a device and it is still visible. If several images are currently displayed on a device then the most recently added image displayed (containing a DATA component) is examined. This information is obtained from the AGI database.% ellpro ESP ELLPRO running. MODE - Use the application interactively? /TRUE/ > Y CURSOR - Use the cursor to identify the galaxy centre? /TRUE/ > Y
The next information required is the name of the display device on which your galaxy is currently displayed - in this case Xwindows. It then looks at the AGI database to determine what image you used to create the displayed image and displays its name to allow you to check that it is the right one. After a brief pause (duration depends on your hardware) the cursor may be used to identify the centre of the galaxy. How this may be done differs slightly from device type to device type. However, it is by use of buttons on an Xwindow and by use of the space bar and buttons on IKONs.
When you identify the location you want, the program reports that location in the Current co-ordinate system of the image, which in this case is SKY, with co-ordinates of RA and Dec. Information about co-ordinate systems associated with an NDF file is held in its WCS (World Co-oordinate System) component. Briefly, the WCS component contains several co-ordinate frames, allowing positions within the data array to be addressed in different ways. Each frame has a label, called its Domain, which usually describes the co-ordinate system; two important ones are GRID (which is always present) and SKY (which may or may not be). At any given time one of these frames is designated the Current one, and this determines the co-ordinates used when positions are requested or reported by ESP or other Starlink packages like KAPPA. You can change between frames using KAPPA's WCSFRAME command. For instance the following would cause all positions to be reported in PIXEL co-ordinates instead:IMGDEV - Which device is displaying the image? /@xwindows/ > xw Using /local2/data/esp/ic3374c as the input NDF. Select the centre of the galaxy to be profiled. Keyboard "2" key: Quit the program. Keyboard "." key: Select the galaxy. Keyboard "1" key: Show the cursor co-ordinates. SKY frame co-ordinates: RA = -11:23:21.6, Dec = 62:13:07
's To find out more about WCS components see SUN/95.% wcsframe ic3374 pixel
Once the galaxy centre is identified, it is necessary to describe how far out from the centre you want the profiling to continue (if possible). This is again achieved via the cursor.
When this has been done, a circle is drawn around the galaxy showing the extent of the profiling requested. This may, or may not, be visible depending on the colour of the image background. However, this can be overcome by use of the command line parameter COLOUR when starting ELLPRO, i.e.:Indicate the outer limit of the galaxy. Keyboard "2" key: Quit the program. Keyboard "." key: Select the outer limit of the galaxy. Keyboard "1" key: Show the cursor co-ordinates. SKY frame co-ordinates: RA = -11:23:17.0, Dec = 62:12:43
Where the valid range of colours (N) for drawing the lines is 0-3.% ellpro colour=n
The next prompts displayed are simple to understand.
The first parameter, FRZORI, asks if the galaxy position you proposed (and refined with AUTOL if required) should be held to be the galaxy centre throughout the profiling operation or, is it allowed to vary slightly from ellipse to ellipse if that provides a better fit? BACK and SIGMA are the modal pixel value in the image and its associated standard deviation. Since the image in this example has a SKY co-ordinate frame (it does not have to be the Current frame), the program then works out the pixel size in arc seconds and reports it. If your image does not have any SKY co-ordinates, then you will be prompted to enter this as the value of a parameter PSIZE. The final group of configuration parameters is as follows:FRZORI - Is the galaxy origin to be frozen? /FALSE/ > F BACK - Background value /6179/ > 760.5 SIGMA - Standard deviation of the background /392/ > 12.07 Using info from SKY frame - pixels are 0.961 arcseconds square.
ZEROP is the base of the scale for the surface brightness plot which will be made. AUTOL will refine the estimate of the galaxy centre position you have proposed with the cursor if set to TRUE. In the case shown it has been requested and the method chosen was a centroid. The last information required is to name an ARD file if one is to be used to define the good parts of the image. In this case `!' is entered because no ARD file will be used. Instead, the whole image will be used. To make sure you're aware of this, the program issues a warning.ZEROP - Surface brightness zerop point (in magnitudes per arcsec) /27.5/ > AUTOL - Automatically search for better origin? /YES/ > yes AUTOLT - Use a centroid? /NO/ > yes ARDFIL - Masking ARD file /@ardfile.dat/ > ! !! SUBPAR: Null (!) response to prompt for parameter ARDFIL WARNING! - ARD file not used.
It should be noted that for those required inputs which match the values suggested by the program, it is sufficient just to press the Return/Enter key to accept the proposed value.
The program then starts to work on the profiles. It first makes a guess at the crude shape of the galaxy at some smallish radius and (hopefully) sensible S/N ratio and displays this. Next, it makes a full estimate of the profile at that radius before dropping down to smaller radii and then increasing upward again until one of the profiling limits (see LIM1, LIM2 and RLIM in Appendix B.1) is exceeded. Results of the profiling activity are displayed as they are calculated. This is done to allow you to see what progress is being made.
Descriptions for the headings may be found in Appendix F.Initial parameter estimates Rad(*) 5.41 Posang 12.1 Ellipt. .692 X Y Points Rad(*) Count PA Ellipt Dev. PPU Statistic Residual calculation: weighted SD 93.3 96.5 76 4.81 114.2 -16.4 0.593 0.9 100. 0.87E+03 93.0 96.1 20 0.16 213.8 -31.7 0.116 0.4 100. 0.97E+03 93.0 96.2 20 0.27 211.6 -23.4 0.141 0.9 100. 0.97E+03 93.0 96.1 20 0.36 211.3 -23.4 0.141 0.8 100. 0.97E+03 92.9 96.2 20 0.45 210.6 -23.4 0.141 0.8 100. 0.97E+03 ---- ---- --- ---- --- ---- ----- --- ---- ---- ---- --- ---- --- ---- ----- --- ---- ---- ---- --- ---- --- ---- ----- --- ---- 93.5 95.8 332 19.93 1.9 -2.9 0.602 0.5 92. 0.76E+03 Mean count below threshold LIM2.
When the application has finished profiling the galaxy it issues a message indicating why the profiling action was stopped.
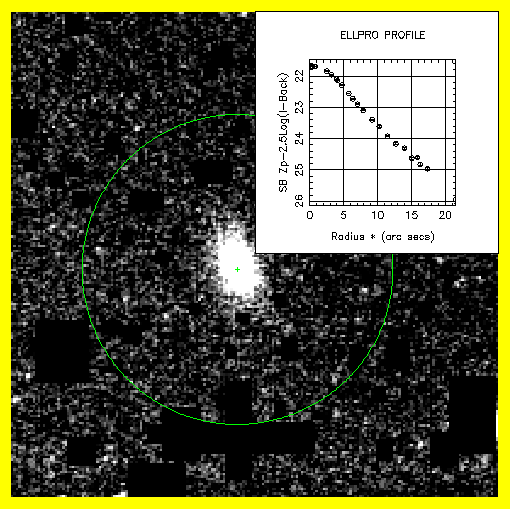
You are then prompted for the name of a device on which the image should be displayed. This is done by first asking you if the device currently displaying the image is to be used and then, if you say no, asking for the name of the new device. In the event that you request the current device as the place the profile results should be displayed, you will be further prompted to indicate (using the cursor) in which quadrant of the screen it is to be shown. It must be remembered that any objects in that part of the screen will, subsequently, be obscured, as may be seen in Figure 3.
SAME - Use the same graphics device for the results graph? /TRUE/ > f
DEVICE - Which device/type to display the graph /@x2windows/ >

OUT - Text file for profile output /@elp/ > testprof.dat
AGAIN - Profile again? /FALSE/ >
Finally you will be asked if you wish to try again. If you answer yes, the program will go back to the point at which you identified the location of the galaxy centre on the image and start again. Where possible, you will not be reprompted for input you have already provided.
You will find that the ESP ELLFOU application works in a very similar manner. Consequently, you are now in a position to profile galaxies interactively and to generate profiles using either intensity (ELLPRO) or contour analysis (ELLFOU).
ESP --- Extended Surface Photometry