2
Data reduction
In this section there will be a discussion of how the data was reduced and
analysed to produce results from the raw spectra and images.
2.1
Spectral Fitting – using FORTRAN
To get values of the physical parameters of temperature, column density and
total emission a program, written in FORTRAN by Dr. Steve Miller, called spexfit
was used. This program had to be studied to understand what various parts of
it did, and to get a grasp of how the FORTRAN language was written (an example
of some FORTRAN code can be found in Appendix A). The program read in a spectrum,
as flux against wavelength, and fitted it against a theoretical spectrum using
a least squares fit procedure. The theoretical spectrum was produced by providing
the program with initial values of the temperature, a constant background and
a H3+ coefficient. To make this program produce a more
accurate fit it was thought that a non-constant background needed to be used
rather than the previously used constant value. This would be especially helpful
in regions were the background level was getting comparable in intensity to
the spectral lines. The background that was to be fitted to the spectrum was
actually the spectrum taken at the centre of Jupiter. In the wavelength region
being examined there is a lot of absorption of solar infrared radiation by methane
in the lower atmosphere. This absorption is not absolute and varies with wavelength,
so there is still a continuum of light reflected off and generated by Jupiter.
The continuum is greatest nearer the centre of the planet’s disc, but
falls off towards the limb. This is because when you look to a certain depth
into the atmosphere at the limb you are looking through more atmosphere than
when looking to the same depth near the centre of the disc, therefore more of
the background light appears to be absorbed at the limb. This effect is called
limb darkening. At the centre of the disc the background continuum drowns out
any H3+ emission lines and therefore can be used as a
background for the rest of the spectrum. In the regions containing the aurorae
the continuum looks very dark, but will actually just be a scaled down version
of the central continuum. The aurorae spread some way away from the limb and
the background can become quite considerable. It is in these regions that fitting
a varying background becomes particularly advantageous. An image of one of the
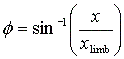
spectra can be seen in Fig. 4.
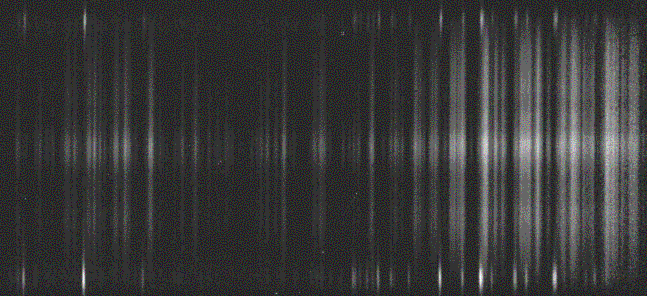
Fig. 4. This image shows one of the spectra from the observations. The bright
H3+ auroral emission can be seen at the top and bottom
of the image, with the Q-branch lines on the left side. The northern aurora
is at the bottom and the southern one at the top. The background reflected light
can clearly be seen, with it dimming towards the limb.
To fit to a non-constant background spexfit had to be slightly altered. To
start with a new variable called FBAK, which would contain the background flux
values, had to be added to the main program and all its subroutines. The data
stream from which the background was to be read was created. From this a new
for-loop was added that read in the flux values. At this time it was assumed
that the wavelength for each spectrum flux value would match that of the corresponding
background value with the same array index, and that there were the same number
of data points for the spectrum and background. The value that was previously
input as a starting value to fit the constant background now had to become a
scaling factor by which the background would be scaled within the fit. The program
with the background fitting was renamed spexbak with an index after the file
name for different versions created when improvements were made to the previous
one (the final version being spexbak5). When writing the program, it was constantly
checked using one particular test spectrum file and one background file. To
test the program the input parameters were varied to see if the same results
were reproduced for each set. If the program was working properly it would produce
very close results for quite widely varying inputs (e.g. varying the input temperature
from, say, 500K to 1500K, should give nearly identical results for bright emission
lines), because the least squares fit procedure should have converged very accurately.
During the intermediate stages of testing greatly varying results where found
even when the input parameters were quite close and this highlighted the problems
within the program. One major problem was that the data files used for the testing
did not have the same array size, which confused the program and meant it came
out with very strange data. This was resolved by adding code that scaled the
background file to cover the same number of points as in the spectrum file.
This bit of code was only added as a precaution, because in the data that was
to be used the array sizes would be made equal before being input into spexbak.
Finally, when all the problems with the program were fixed, it produced the
highly similar results expected for different inputs.
With the test files it was found that the background array and spectrum array
differed in wavelength by 0.003µm between corresponding points. This was due
to the spectrograph and calibration data, and it meant that the wavelength was
a function of the position on the spectrograph slit. There was an attempt to
resolve this difference in wavelength within spexbak, but it was decided that
it would be easier for Dr Tom Stallard to include within his data calibration
and reduction procedures (more on this later).
To see how the program with the constant background compared to that with the
varying background, both were run with the same data and input parameters. The
value of the standard deviation of the fit with the constant background was
0.0187, and that with the varying background was 0.0163, giving an improvement
in the fit of approximately 10 – 15%. This was quite an impressive improvement
given that the level of the background on the test spectra was low and when
looking at the fits they did not appear to differ much. Figs. 5 and
6 show part of the spectra fitted with a constant background and varying
background respectively.
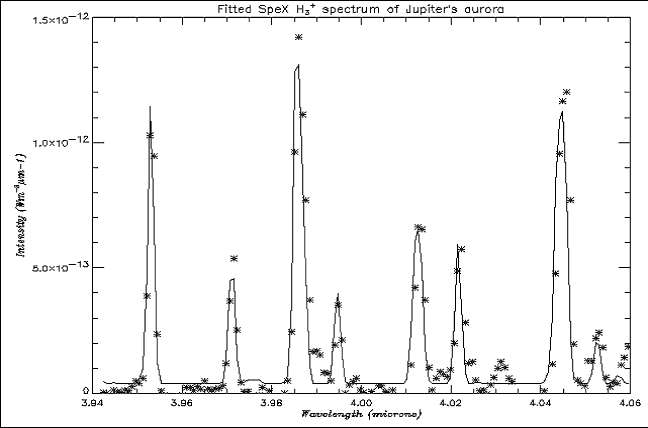
Fig. 5. Q-branch fundamental spectrum, from the centre of the aurora, fitted
with a constant background. Solid line shows fitted spectrum, * show observed
spectrum
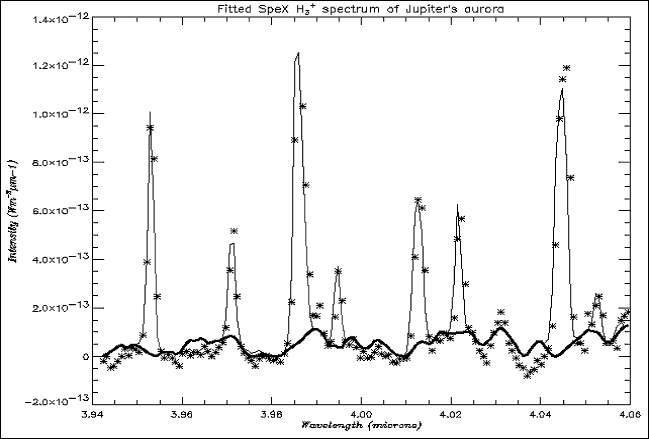
Fig. 6. Spectrum fitted with scaled varying background, with background
shown as the thick solid line
2.2
Data processing – using IDL
For this part of the project the programming language IDL (Interactive Data
Language) had to be learnt from scratch to a reasonable level of proficiency
(for an example of IDL code and all the procedures written see Appendix A).
The raw spectral data that was obtained by the SpeX instrument was of no use
to put through the spexbak program until it had been reduced and calibrated
properly. Also spexbak gave no positional information as to where on Jupiter’s
disc each spectrum was taken from. This information would be needed to give
the parameters meaning, and enable maps of the aurorae to be produced. A program
was therefore needed which could reduce the data into a workable form. Dr Stallard
wrote such a program in IDL code. This program, called spex_output_jup.pro,
used several procedures to; locate the time and positional information for the
planetary image (i.e. the centre point of the disc, the relative position of
the slit to the centre); load the spectrum for that image and calibrate it (it
needed to be flux calibrated with a star of known flux, and the array needed
to be corrected for the slight wavelength variation across the slit as stated
before); and to mark off the auroral regions that were to be studied and get
the positional information on them. The program did not do all these things
automatically, but called on the user to locate the centre of the planet (using
crosshairs scaled to the calculated diameter of the planet) and select the auroral
regions by eye. The only part missing was a procedure to pass the spectral data
through spexbak and readout the results into files.
The IDL procedure produced large arrays of intensities for the region that
was selected, and an array for the wavelength over that spectrum. There was
also an array produced that held a single row for the background intensities,
taken from the centre of the planet. The new part of the procedure had to read
the wavelength and intensity data to two two-column text files called fort.1
and fort.11, for the spectrum and background respectively, which would be recognised
by spexbak. Dr Stallard’s program gave two sets of arrays for the northern
aurora (which corresponded to the bottom of the spectrum image) and two sets
for the southern aurora (which corresponded to the top of the spectrum image).
One array contained the data for the left side of the spectrum and one for the
right side of the spectrum. The left array contained the emission lines from
Q-branch of the H3+ ro-vibrational spectrum, which were the best lines to give
accurate fits for the rotational temperature, and covered a wavelength region
between ~ 3.7 – 4.2µm. The right array contained lines that were actually
a reflection of the far left of the spectrum, caused by internal reflections
within the spectrograph, and therefore covered a wavelength range of ~ 3.4 –
3.7µm. These lines were far less useful in giving accurate temperatures, but
could be used as a double check of the more accurate temperatures, to see if
they varied in the same way. The wavelength array was not split into two parts,
so it needed to be split up. To do this the length of each row (the amount of
pixels contained in it) for the left and right arrays needed to be known. It
was found that the left array covered the pixels from 0 – 655 and the
right array covered the pixels from 656 – 1024. In the initial procedure
that was written it was decided to use the whole of the 0 – 655 and 656
–1024 arrays for the fit. It was also decided to test the data from just
one row of the left and right of the top (southern aurora) spectrum, rather
than spend time running through the whole thing. The left side gave a temperature
value of 809K with a standard deviation (s) of 3.6*10-3 when put through spexbak,
and a temperature of 1005K with s = 6.0*10-3 when put through spexfit.
This, therefore again seemed to show an improvement when fitting with a non-constant
background. At this point spexbak only output the values of the parameters to
the screen, but they needed to be output to a file for later use, so the program
was updated to do this.
The previous values of temperature obtained seemed to be good at the time,
but when repeated with different input parameters, different temperatures were
found. This indicated that there was something increasing errors in the fitting.
A small IDL procedure was written, based on one called readfit written by Dr
Miller, which showed the fit against the actual spectrum and overlaid the background.
This was used to look at the fits just obtained and see how they compared to
the actual spectrum and background. From looking at the fit it seemed to work
well, with fitted lines and actual spectral lines matching, although there was
a lot of noise at the right edge (wavelength > 4.1µm onwards). The spectrum
for the right hand side was looked at next to see how its temperature values
compared with those on the left. The background in this region was much less,
but the temperature of 1630K that it produced was much higher than it should
have been. These tests of the program were only done using one row of one particular
spectrum, but other anomalous results were found when looking at other parts
of the spectrum, which were caused by the same errors.
One of the first reasons to be to be thought of as to why the fits were quite
anomalous was that the test were done with rows quite close to the inner edge
of the aurora, where the background would be getting large. This was later found
not to be the reason. As quickly noted above, the edges of the spectra, where
the methane absorption was not as good, were quite messy. It was therefore decided
to remove these messy parts, as they contained no lines useful for the fitting
and produced greater error by being there. This was done by cutting the edges
of the array as they were read in. The amount of pixels that needed to be cut
was determined by looking at the spectrum using the aforementioned readfit.
The left side was cut for pixels at wavelength > 4.05µm and the right side
was cut for wavelengths < 3.53µm. The program was again tested with and without
the cuts, and produced results with lower standard deviations for those where
the cuts had been made. It also produced, for positions at the centre of the
aurora and on the right at least, values of temperature that only varied by
~0.1K when different inputs were used.
At this point it was thought that the signal-to-noise-ratio (SNR) at the edges
of the aurora would be too low to give accurate fits, so it was decided that
maybe adjacent rows should be added together to increase the SNR. A disadvantage
of this process would have been that it would reduce the spatial resolution
at the edges of the aurora, when one of the original reasons for the use of
the SpeX spectrograph was that it gave high spatial resolution. A problem with
doing this was that suitable points needed to be chosen at which it could be
said that the SNR was too low and rows needed to be added together. This point
would also vary across the aurora, and for each of the different spectra. To
see if this really needed to be done the fits for the edges of the aurora were
tested, but they were found to be quite good, with the non-constant background
in the fit coping very well with the large background in the spectrum. Figs.
7 and 8 show the inner edge of the aurora fitted with a constant
and varying background respectively. Therefore, it was decided that SNR was
acceptable, even for the edges of the aurora.
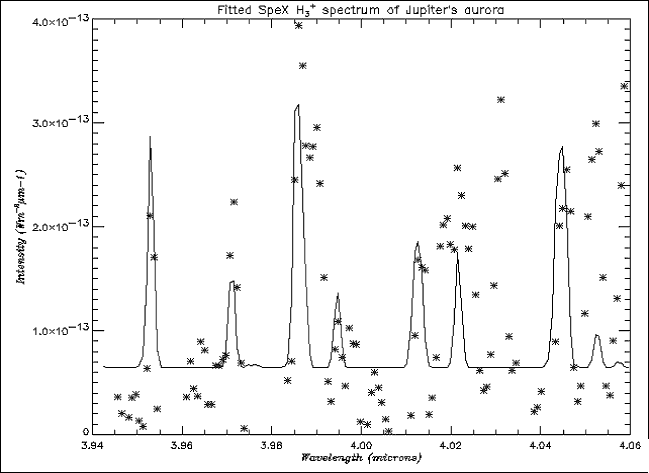
Fig. 7. Spectrum from the inner edge of the aurora fitted with a constant
background, which does not seem to show a good fit for any lines
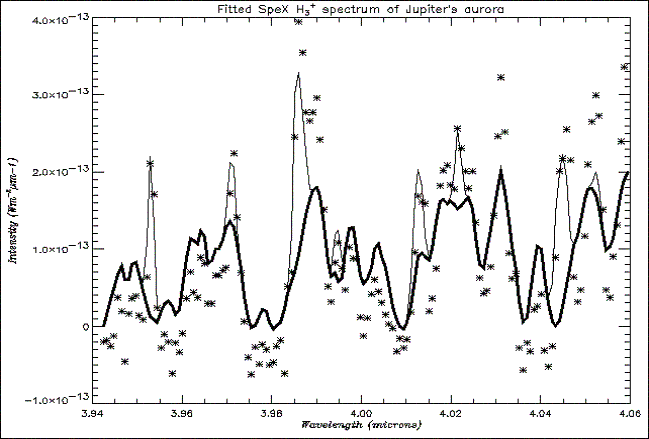
Fig. 8. Spectrum from the edge of the aurora fitted with a scaled, varying background.
Several of the lines produce a good fit
Although the mess at the edges of the spectrum had been cleared, to produce
the best temperature from the left side, only the Q-branch lines needed to be
used. This meant cutting down the array considerably from both sides, leaving
a wavelength range of only ~3.94 – 4.06µm. This range still contained
8 emission lines, so the accuracy of the fit would be very good. When viewed,
this range was fitted excellently by spexbak (see Figs. 5 and 6).
Due to the success of narrowing down the range of lines used on the left side,
it was decided to check whether this would work for the right side. The range
was first reduced to a triplet of lines and then a single line, both of which
gave temperatures of around 350K, which was much too low. Lam et al. (1997)
said that this right region had a rather random selection of lines making determination
of physical parameters rather difficult, although it did have the advantage
of little background noise (this wasn’t so critical in this study as only
the auroral regions, where background noise is fairly small were being looked
at and that background was included in the fit). Therefore, to get the best
determination of the parameters with the random lines, it was thought best to
use all of them and just cut off the noisy part as before.
The program now needed to be looped, so that it gave out results for the left
and right sides of the whole of the north and south aurora. This was achieved
by finding the size of the array covering the selected auroral regions (the
left and right would be the same size) and including a for-loop over the left
and right arrays separately. The fact that the spectral arrays were cut down
meant that this had to be accommodated for in the loop, so it could start at
the beginning and finish at the end of each row. It was decided to put the north
and south aurorae as separate procedures called spex_output_bottomaurora.pro
and spex_output_topaurora.pro respectively. The reason that the north aurora
was at the bottom and the south aurora at the top was due to the way the spectrum
was orientated when viewed on the screen, although the spectral rows were read
in from bottom to top. These two procedures also had to output the positional
information (the relative pixel number from the centre) for each temperature,
column density and total emission reading. The fact that the south aurora was
at the top meant that its rows were given positive positions, and the north
aurora’s were given negative positions. This had to be accounted for later
when working out latitudes.
The above two procedures were added to spex_output_jup.pro and this was renamed
spex_output_jup2.pro. To this a few lines of code were added to print the overall
information about the image (the image number, the time of the exposure, the
central meridian longitude (CML) and the relative slit position) to a file called
positiondata. It was then ready to run through a whole spectrum, rather than
just the small parts of the spectrum used in testing. The program would output
five files for each image/spectrum. These would be positiondata, as above, and
four others for the left and right of the north and south aurora, containing
the pixel position relative to the centre, and the temperature, column density,
total emission and standard deviation for that particular position.
There were a total of 21 images/spectra to go through, and due to the positioning
being done by eye, it would have been hard to automate the process. This meant
that each one had to be input separately. The program took about 30 minutes
to run for each image, with initial values of the temperature, H3+ coefficient
and background scaling being 1000K, 0.25 and 0.01 respectively. The variation
of temperature with different initial values can be seen in Table 1.
| |
Initial Temperature (K)
|
| 700
| 800
| 900
| 1000
| 1100
| 1200
| 1300
|
| Pixel position
| Fitted Temperature (K)
|
| 128
| 920
| 990
| 991
| 991
| 991
| 991
| 991
|
| 127
| 940
| 1010
| 1022
| 1022
| 1022
| 1022
| 1022
|
| 126
| 970
| 1050
| 1081
| 1081
| 1078
| 1081
| 1081
|
| 125
| 960
| 1040
| 1057
| 1057
| 1054
| 1057
| 1057
|
| 124
| 940
| 1020
| 1027
| 1027
| 1027
| 1027
| 1027 |
Table 1. This table shows how the fitted values of temperature
varied when different initial temperatures were used in the spectral fitting.
Values of H3+ coefficient and background scaling were kept at 0.25 and 0.01
respectively for all fits.
The table shows that for initial temperatures above 900K the fitted temperatures
converge very well, with initial temperatures below this starting to show deviation.
The fact that the same results are produced for quite a wide range of initial
temperatures seems to indicate that these really are the best fits to the data.
As the other parameters are calculated from the temperature the same result applies
to them.
2.3
Data display – using IDL
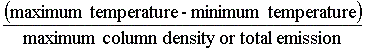
To display the data across the aurora, for each image quickly and in an easily
analysable form, a small procedure, called readtemp.pro, was written. Again
this procedure was based on readfit.pro, by Dr Miller, and also included code
to plot the results as postscript files, so they could be printed. The results
were plotted against pixel number, with the temperature scale as the ordinate.
To plot the column density and total emission on the same graph they were scaled
to the temperature by multiplying by a factor of:
These plots were useful for seeing the variation across thin strips of the
aurorae, but did not give a complete picture showing the overall structure.
To do this the ‘strips’ needed to be combined into intensity maps.
This would need to use all the positional data combined with the parameter results,
with some kind of interpolation between the various strips to create a full
picture. It was hoped that these maps might also be presented as three-dimensional
images overlaid onto a sphere, to provide a realistic view of the variation
of the parameters across the aurorae.
2.4
Mapping
Before the mapping could begin the column density and total emission had to
be corrected for line of sight effects. These effects are basically the opposite
of the limb darkening mentioned earlier, whereby as you near the limb you are
looking through more atmosphere, and therefore get more emission in a particular
line of sight. With this greater intensity near the limb factored in, it reduces
the column density and total emission. The line of sight procedure used in this
study was adapted from that used in Paper I, but differed due to data in this
study being in a north-south plane, and its having an east-west orientation
with constant lines of latitude. The line of sight mapping was written as two
procedures called los_lat.pro and los_long.pro for the latitudinal and longitudinal
directions respectively. Limits had to be set on the line of sight corrections
in case any points were off the limb of the planet, where double atmosphere
effects would come into play. For these positions the correction was set to
a constant value of 0.1 to dim any effect. To see if the procedures worked properly
constant values of total emission and column density over a range of positions
were input. These values produced an even curve as expected. Fig. 9
shows an example of the line of sight scaled values of total emission across
the north aurora against the non-scaled value.
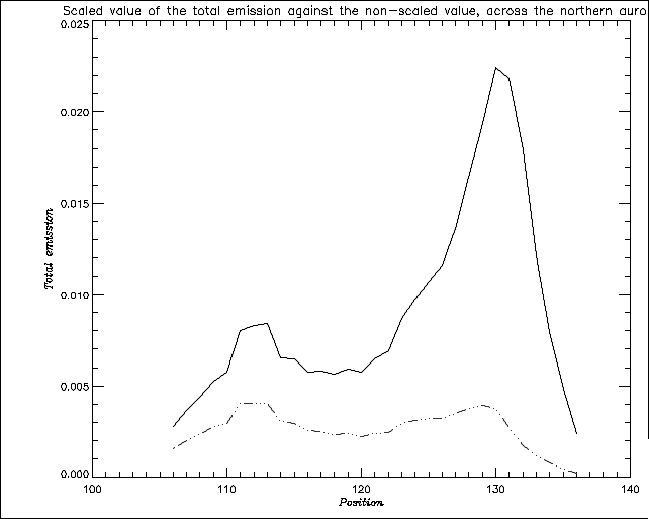
Fig. 9. Line of sight scaled value of total emission (dashed line) against
non-scaled value (solid line)
To produce the maps the pixel number values had to be converted into longitude
and latitude positions on the planet, which could be displayed as a flat image.
To do this the angular size of Jupiter on the date of the observations needed
to be known. These values could be found from the Astronomical Almanac 2001,
although no value was given for the 6th Feb, with the closest available values
being for the 4th and 8th Feb. The assumption was made that the angular size
varied linearly over time, so the means of the values given in the Almanac were
used. As Jupiter is not spherical but is an oblate spheriod, due to centrifugal
forces, the angular diameter across the equator is larger than that at the poles.
Values of 41.73” for the diameter at the equator and 39.03” at the
pole were used. This oblateness needed to be taken into account in the working
out of coordinates, with the disk of the planet being modelled, to a good approximation,
as an ellipse. The relative slit position for each image gave an x-value pixel
position, for all the y-value pixel positions on the corresponding spectrum.
For each image a value of y where the slit crossed the limb needed calculating.
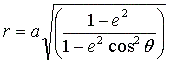
This was done using the equation for an ellipse:
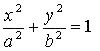
where a is the semi-major axis (radius of Jupiter at the equator), b is the
semi-minor axis (radius of Jupiter at the poles), x is the relative slit position
and y gives the limb position. The respective angular diameters at the equator
and pole had to be converted from arcseconds to number of pixels. What also
had to be taken into account was the difference in spatial resolution between
the image and the spectrometer, whereby the image had 0.12” per pixel
and gave the x-value and the spectrometer had 0.15” per pixel and gave
the y-value. Therefore one set of values had to be converted to be on the same
scale as the other. The latitude, q, was given by the equation:
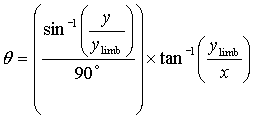
where this time y was the varying y-value along the slit and ylimb was the
y-value at the limb for that slit position. To get the longitude the radius,
r, of the planet and the x-value of the limb, xlimb, at each y-value had to
be calculated
and 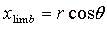
where, 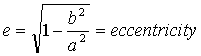
the longitude, f, was then given by
These procedures were written in the program get_latnlong.pro, which also saved
the position data into files. The procedure was tested, but gave a considerable
amount of off planet data points, with in one case 20 off planet points (over
half of the data set). This was obviously not acceptable, as too many points
were being lost. It was expected that there would be a few off planet points
due to smearing of the edges of the image of the planet, but the amount seen
was not accountable from this. To check whether the errors were caused by the
manual positioning done earlier, it was repeated several times to see if large
variations were given. The results were found to be the same with only a ±1
pixel error being present. The amount of off planet points also correlated well
for both the north and the south data indicating that the centring was not greatly
out. This was therefore ruled out as the main source of error. A larger contribution
was more likely to come from the values of angular diameter given in the Astronomical
Almanac. These values were those for the diameter at the 1 bar atmospheric pressure
levels, where in this study the ionosphere is being studied, which extends far
above the 1 bar level. The fact that the variation of the angular diameter between
4th and 8th Feb. was assumed to be linear could also introduce a maximum of
a 4 pixel error, although it is very unlikely to be as much as this. Slight
differences for the spatial resolution values of 0.12” and 0.15”
per pixel used i.e. including more significant figure could also introduce more
error. The size of the planet was increased by 20 pixels to compensate for the
off planet points on the worst case, which produced only on planet points, although
overcompensated too much by leaving the data sets that were not badly affected
by off planet points with latitudes that were too low. The data sets with larger
numbers of off planet points seemed to be the ones in which the images were
most blurred by bad seeing, which could cause more smearing out of the data.
The line of sight corrections and the longitude and latitude calculations were
put together in the procedures northaurora.pro and southaurora.pro.
To produce maps for each parameter, all the data for each one from each of
the 21 data sets needed to be input into an array of longitude and latitude.
The data points could then be interpolated between to fill in the map. The north
and south aurorae were to be put into separate arrays to start with and then
combined after the interpolation process. The array was created with double
the number of longitude and latitude points than the data actually contained,
so that if any data points were close together the program would not try to
bin them in the same space. Fig. 10 shows the lines of data, when placed
into an array of longitude and latitude.
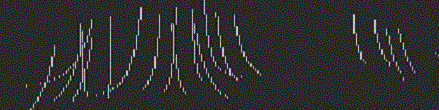
Fig. 10. This figure shows the data points placed into and array of longitude
and latitude. The lines curve due to the spectrometer slit not being held on
the CML, so the longitude will vary along the slit.
These lines of data needed interpolating between and it was decided that a
linear interpolation process would be the least complicated way of doing this.
A linear interpolation would be okay when the lines were close together, as
there would be less chance to deviate drastically, but would obviously provide
far less detail or true features between lines a significant distance apart,
i.e. the lines of the right hand side of Fig. 10.
The interpolation process was done first in longitude and then in latitude.
The procedures (northinterpolation.pro and southinterpolation.pro) counted the
number of data points in each row of the map array. They would then work out
the difference between consecutive values and divide this by the number of points
between the two. This would give a value for the increment that each point between
the two known values would have to be varied by. For the latitudes the process
was repeated except that it was the number of data points in each column that
was counted. This had to be done separately for each parameter for the northern
and southern aurora, giving 6 different maps. The northern and southern maps
for each parameter were combined using a procedure called make_map.pro by creating
an even larger array of 720 by 360 spaces (2 spaces for each degree of longitude
and latitude) and placing both maps into it. Again this was done for all three
parameters. The maps will be discussed in more detail in the results section.
An example of such a map can be seen in Fig. 11.
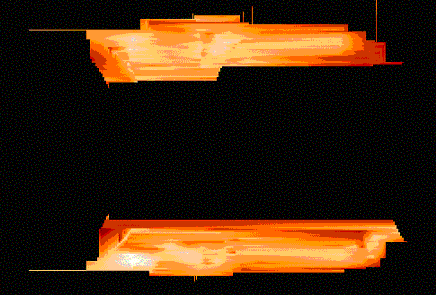
Fig. 11. The interpolated temperature maps for the north and south aurorae.
The image had been cropped so that the entire map array is not seen, although
the cropped region contained no data
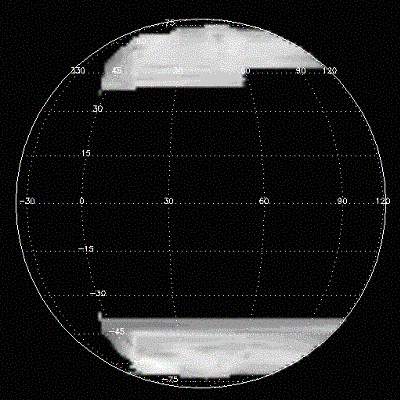
Fig. 12. The temperature maps of the northern and southern aurorae projected
onto a sphere, and viewed at a latitude of 0o
To try and give a truer idea of how the parameters varied, with reference to
the actual auroral morphology, the maps where projected onto a sphere. The procedure
to do this was provided by IDL, with several different map projection options.
This was added to make_map.pro. The orientation from which to view the aurora
could be selected, along with grid coordinates. Fig. 12 shows an example
of the temperature map projected onto a sphere.
top | introduction
| results | discussion
| conclusion
home | about me
| research |
links | travels
| pictures | e-mail me