Balltracking - An ultra efficient method for tracking flow fields
2. Filtering the MDI continuum data
 |
 |
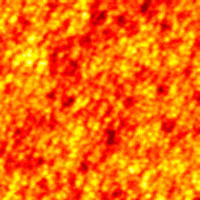
| Raw MDI continuum data (55x55Mm) |
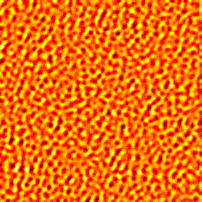
Fourier filtered data (55x55Mm) |
The figure above shows a comparision of raw and filtered MDI data. In the unfiltered image the granulation is nearly invisible due to the high amplitude p-mode signal. After Fourier filtering the ganulation pattern is clearly visible. Note that the spatial resolution of the data only allows features on the scale of the largest granules to be seen. No time domain filtering is used to avoid spurious temporal correlations.

