A typical interactive plot appears below.
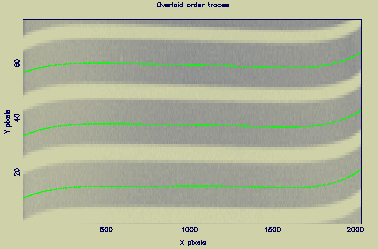
- Using a graphics device to plot the paths of all orders (ech_trplt task/option).
The tracing of the echelle order paths is central to the entire extraction process and care should be taken to ensure the best traces possible. ECHOMOP provides a large number of processing alternatives to help ensure this can be done. Most of these provide information such as RMS deviations etc. when run.
In general however, the best way of evaluating the success or failure of the tracing process is to visually examine the paths of the trace fitted polynomials. Three methods of viewing the traced paths are provided.
  -  Viewing the fitted paths overlaid on an image of the
     trace frame as tracing is done (Set parameter DISPLAY=YES).

      A typical interactive plot appears below.


  -  Using a graphics device to plot the paths of all orders
     (ech_trplt task/option).
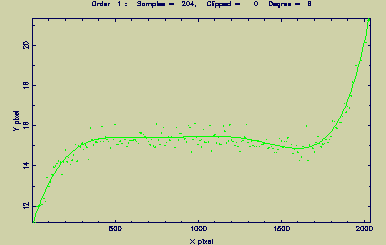
For a single order, more detailed examination of the relation of a trace polynomial to the points it fits, can be obtained using the V(view) command in the ech_fitord task/option.
A typical interactive plot appears below.
Martin Clayton