 Once the dekker limits have been determined, the object profile
is measured. The object is sampled by averaging the profile
over all orders (using the central columns of the frame only).
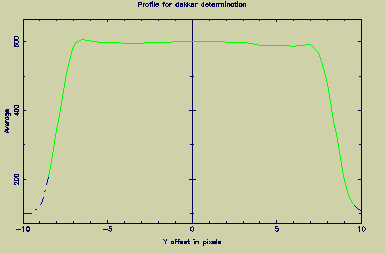
The determination of the position of the object data within the slit proceeds by first locating the slit jaws. To do this either an arc frame or (ideally) a flat-field frame may be used.
The profile is calculated along the slit and the edges are then located by determining the points where the profile intensity drops below a tunable threshold. For problem cases the dekker positions may also be indicated manually on a graph of the arc/Flat-field profile.
A typical interactive plot appears below.
 Once the dekker limits have been determined, the object profile
is measured. The object is sampled by averaging the profile
over all orders (using the central columns of the frame only).
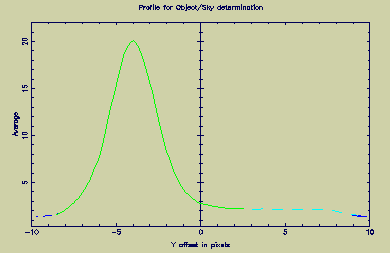
The median intensity of the profile inside the dekker limits is then calculated and used to set an expected sky threshold.
The profile is then examined by stepping outwards from its peak until the profile intensity falls to the expected sky threshold.
Masks are then created in which each pixel along the slit is flagged as sky or object. These masks may be interactively edited and particular sections of the profile flagged as sky or object. Only pixels flagged as 'object' will contribute to an extraction.
A typical interactive plot appears below.
 Therefore, profile editing provides a simple (though tedious)
mechanism for producing spatially resolved spectra (each spatial
increment in turn is flagged as the only object pixel in the
profile, and extracted).
The default behaviour is to average all the orders together thus generating a composite profile. In certain circumstances it may be necessary to derive a separate profile for each order (for instance for multi-fibre spectra). To select this option set TUNE_USE_NXF=1.
Martin Clayton