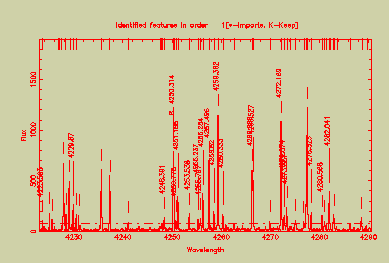
The interactive option displays a plot of the arc and marks the positions of possible arc lines. Any identified lines are labelled with their wavelengths. Once a wavelength scale has been calculated then the positions of all the reference list arc lines are shown along the top of the plot. A typical interactive plot appears below.

I (interactive identification), enters the interactive line specification/examination section. This section provides features for addition/deletion/re-fitting/listing etc. of identified lines.
This submenu provides a set of interactive options to assist in identifying arc lines and fitting the wavelength polynomial to describe the variation along an order. The options provided are as follows and are all selected using a single character. Note that the RETURN key is not necessary for option selection, care is therefore needed to ensure that the cursor is correctly positioned before a cursor-dependent option is selected.
Martin Clayton