Laboratory Project: Galactic Composition by Spectral Classification
Summary
In this, final, part of the experiment you will use recent high resolution
data to classify the spectral type of stars in the Open Cluster NGC 6178.
Then, by comparing the position of the cluster stars in a colour-colour
diagram with their theoretically predicted position, you will be able
to estimate the amount of interstellar reddening in the foreground
of the cluster. This part of the experiment, like the preceding part,
is closely related to ideas which will be covered in the A2Z course Stars
and Their Spectra.
Introduction
Open Cluster NGC 6178 is a compact - and rather beautiful - star cluster
in the constellation of Norma, lying at a distance of about 1 kpc. It was
discovered by Sir John Herschel at the Cape of Good Hope Observatory, using
an 18 inch telescope. He described it as having a "chief star 9th mag of
a small bright clustering group of from 12 to 20 pretty large stars, with
stragglers". Click here to see a modern
CCD image of the cluster.
| Task 1
NGC 6178 can be found on Field 276 (RA 16h20m, Dec -45 deg), centred on location 66mm from the left hand edge and 148mm from the bottom edge of the plate. Using the glass magnifier, see if you can locate NGC 6178 on the direct view Schmidt plate, and then on the plate showing the spectra of the same starfield. Note how the spectra are densely crowded, and how difficult it would be to determine the spectral classes of the cluster stars by pattern matching, as in the first part of the experiment. |
Colour-Magnitude Diagram of NGC 6178
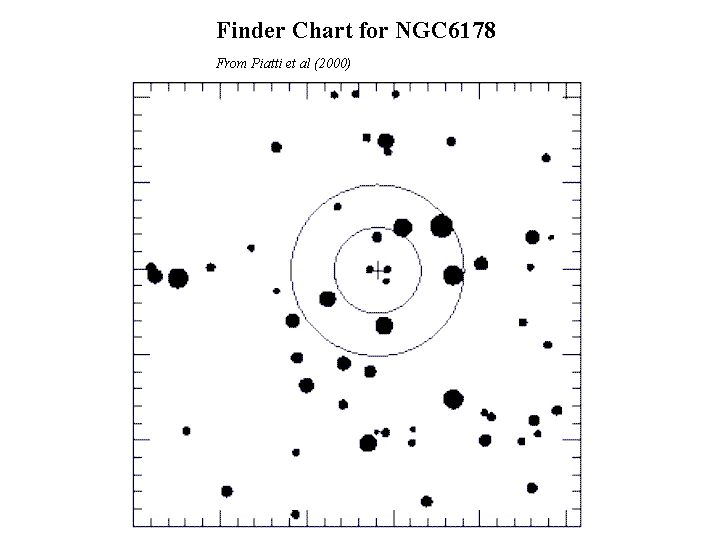
In a recent paper, Piatti et al. (2000) published CCD photometric and spectroscopic data on NGC 6178, and several other clusters. The diagram below is a Finder Chart for the cluster: this is the map which astronomers use to help them locate the correct stars when they arrive at the telescope to begin their observations. (You will also be given a hard copy of this Finder Chart. Here the inner and outer circles have radius 50 and 100 CCD pixels respectively, and are centred on the centre of the cluster).
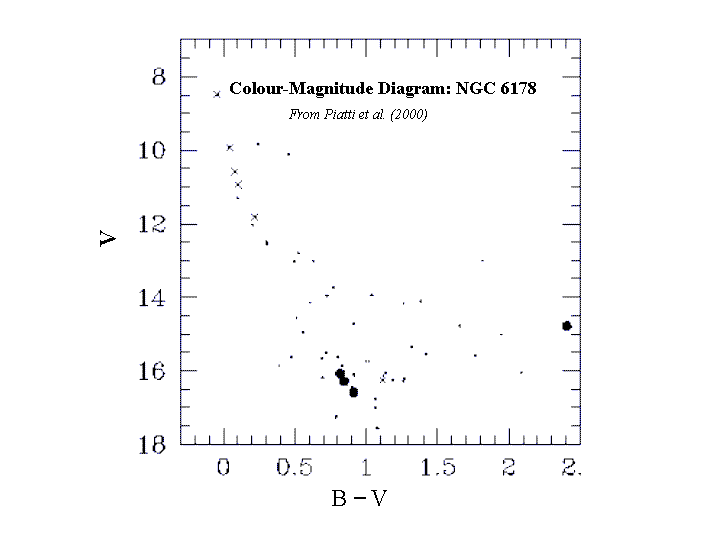
Using these data Piatti et al constructed a colour-magnitude diagram: a plot of V band magnitude versus B-V colour for the stars in the cluster. This is shown below. The four stars in the inner circle of the finder chart are denoted by filled circles; the six stars in the outer circle are denoted by crosses.
Spectroscopy of NGC 6178
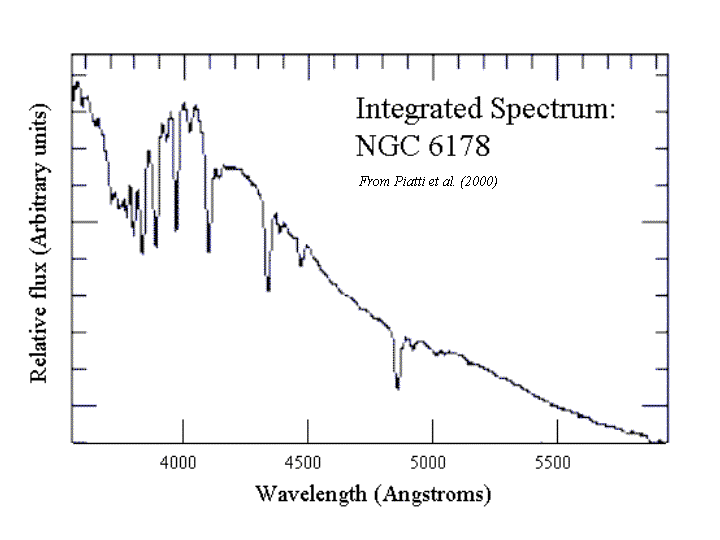
Piatti et al also carried out spectroscopy of NGC 6178 - not of the individual stars, but an integrated spectrum for the core of the cluster. This spectrum is, therefore, dominated by the stars within 100 pixels of the cluster centre and is essentially a mean spectrum (weighted by the brightness of each star) of these central stars. (You will also be given a hard copy of this spectrum).
| Task 2
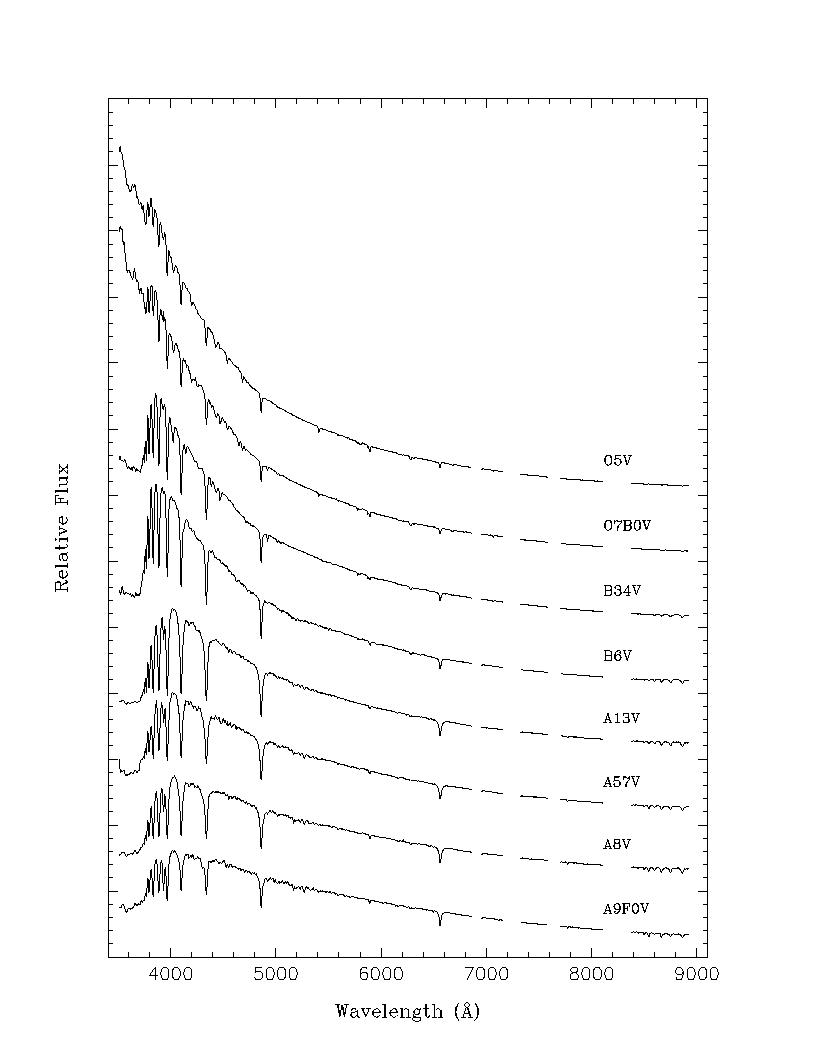
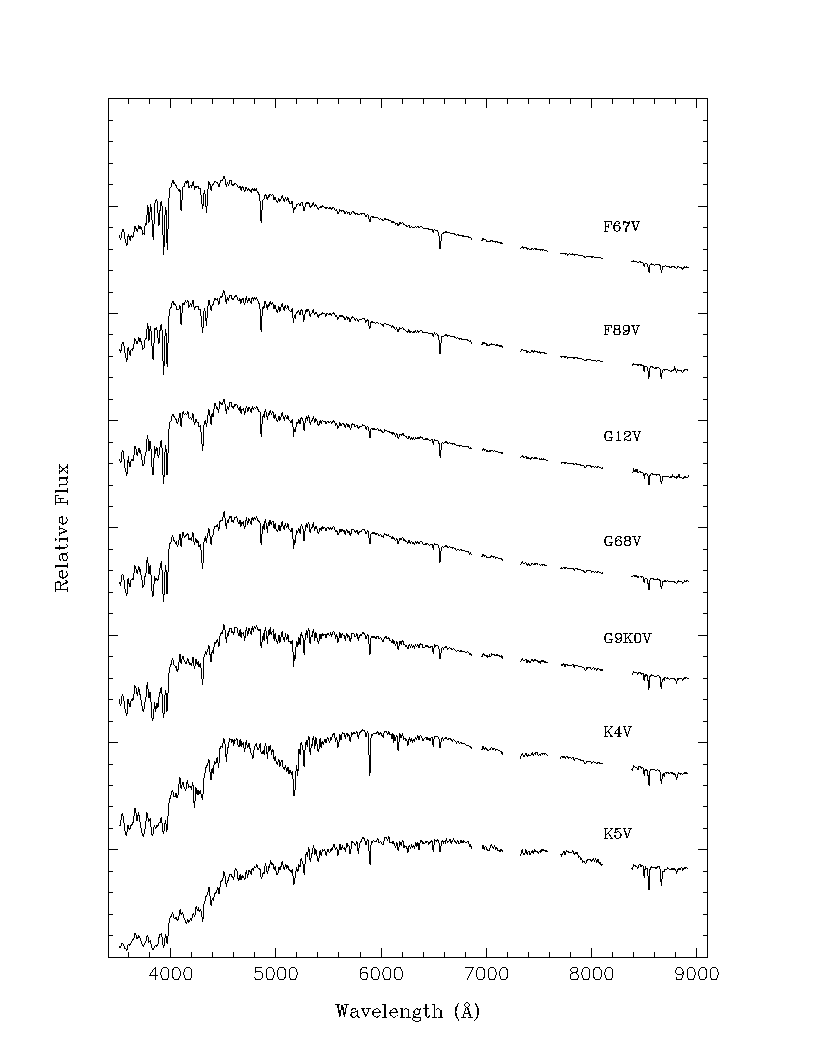
Compare the integrated spectrum of NGC 6178 with the template spectra for Main Sequence stars given below (click on the image to see an enlarged version). Identify - in your judgement - the spectral class which most closely matches the NGC 6178 spectrum. (Note that these template spectra divide the Harvard spectral sequence into sub-classes. Not every sub-class has a template shown here, and some templates are indicated as appropriate for two spectral classes - e.g. G12V = G1V and G2V). Can you estimate an error for your classification? |
U,B,V photometry of stars in NGC 6178
The table below lists U, B and V band photometry (see your A1Y stellar
physics notes for more details on this) for 19 stars in NGC 6178.
The positions of these stars can be related to the Finder
Chart and full CCD image of the cluster
using a key diagram.
| Star | U magnitude | B magnitude | V magnitude | Star | U magnitude | B magnitude | V magnitude |
| 1 | 7.54 | 8.44 | 8.40 | 11 | 14.64 | 14.48 | 13.80 |
| 2 | 10.26 | 10.67 | 10.48 | 12 | 13.47 | 13.32 | 12.84 |
| 3 | 9.45 | 10.01 | 9.90 | 13 | 13.03 | 12.87 | 12.59 |
| 4 | 13.59 | 13.46 | 12.99 | 14 | 14.81 | 14.60 | 14.16 |
| 5 | 10.88 | 11.08 | 10.83 | 15 | 15.75 | 14.86 | 13.01 |
| 6 | 11.88 | 12.06 | 11.75 | 16 | 13.68 | 13.60 | 13.04 |
| 7 | 11.32 | 11.43 | 11.30 | 17 | 14.84 | 14.46 | 13.69 |
| 8 | 10.71 | 10.66 | 10.14 | 18 | 9.94 | 10.06 | 9.85 |
| 9 | 7.76 | 8.43 | 8.41 | 19 | 12.81 | 12.60 | 12.24 |
| 10 | 12.40 | 12.24 | 12.03 |
| Task 3
Compare the Finder Chart and cluster key diagram for NGC 6178. Identify the stars which, in your judgement, dominate the integrated spectrum from the core of the cluster, explaining carefully the reasons for your choice. Use the data in the above table to determine mean values of U-B and B-V colour for these stars. |
Determining the Reddening of NGC 6183
Identification of stellar spectral types is a powerful tool for determining the amount of interstellar absorption in open clusters. This is essentially because of the well-defined position in a colour-colour diagram ofstars of different spectral types. The diagram below shows plots of the theoretical values of U-B and B-V colours for stars across the full range of the Harvard spectral sequence. The solid curve shows U-B versus B-V for main sequence (luminosity class V) stars; the dashed curve is for supergiants (luminosity class I). The solid line (marked BB) shows the theoretical variation in U-B versus B-V colour for a perfect Black-Body radiator. (You will be given a hardcopy printout of this figure).
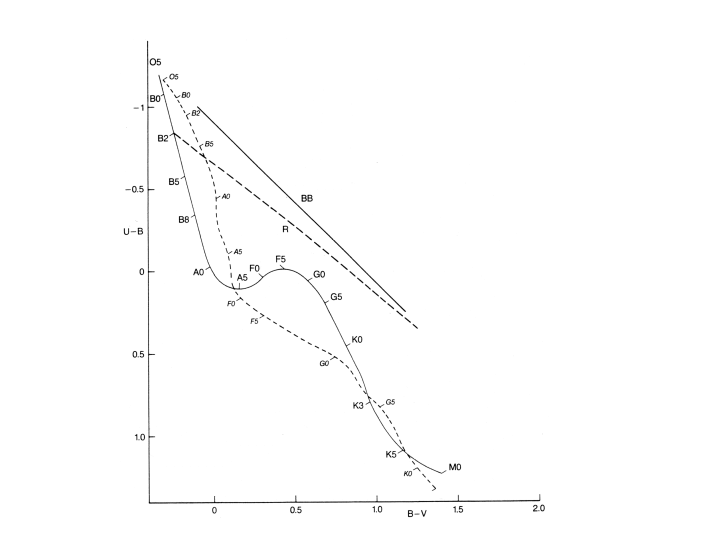
The dashed line (marked R) shows an example of a reddening line, for a main sequence star of spectral type B2. In the absence of absorption the star would appear at the left hand end of the reddening line, at the position marked B2. The effect of absorption, due to interstellar dust, is to make the star appear dimmer in all three wavebands: U, B and V. The absorption is different in each waveband, however; this has the effect of shifting the position of the star in the (B-V,U-B) plane.
The ratios of U absorption to B absorption, and B absorption to V absorption, are approximately constant - i.e. the U, B and V absorptions maintain the same proportion from star to star. The amount of absorption in each of these bands can also usually be taken to be a constant (different for each of U, B and V) multiplied by the colour excess or reddening - denoted by EB-V. This means that the effect of absorption will move the star along a straight line in the (B-V,U-B) plane - which is the reddening line shown in the diagram. (Ask the Lab Head or demonstrators if you would like to understand why the star moves along a straight line, although you might want to think about this question for yourself). Hence, determining the reddening of a cluster is an important step in correcting for interstellar absorption.
The reddening of a star is defined as
where (B-V) is the observed colour index and (B-V)0
is the true colour index of the star.
| Task 4
Using the observed mean values of U-B and B-V colour which you obtained in Task 3, plot the position defined by these observed mean values on your colour-colour diagram. Now draw a line parallel to the reddening line until it intercepts the solid curve, which shows U-B versus B-V for main sequence stars. (This point of interception represents the true mean values of U-B and B-V colour for the stars which you selected in Task 3). Estimate the mean spectral type of your selected stars from their true (B-V,U-V) coordinates - i.e. from the position at which your straight line intercepts the main sequence curve. Does this spectral type agree with the spectral classification which you made in Task 2, when you compared Piatti et al's integrated spectrum with main sequence templates? Using your observed mean value of B-V for the selected stars and their true mean value of B-V (which you have just deduced), estimate the reddening of NGC 6178. |
last updated 30/10/01