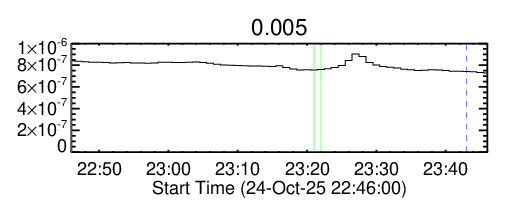
The GOES XRS-B (1-8 Å) shown with a linear scaling (W/m2) in the black histogram with a sliding Y-axis scale, normalized to C units. This information comes from the NOAA one-minute near-real-time data. The title line shows the current GOES flux level by letter, with horizontal lines lines for [C, M, X] shown as [dots, dash-dots, dashes] when on the scale. The blue dashed vertical at the right marks the end of data as restricted by the latency of the NOAA posting. The RMS number in the title line shows the standard deviation of the hour's flux, normalized to the median. The number in the legend (e.g., .005) gives the differential EM threshold, in units of 1049 cm-3 above 6 MK, for the alert flag setting. This should pick up all C-class events as indicated by green verticals. The verticals become gold and red at successive 10x thresholds, the approximate levels for eventual M or X flare occurrence.