Supergranulation evolution and magnetic fields
The movies on this web page are linked from 2 different articles (1,2) in Solar Physics
Contents
-
Tracking supergranular cells over time
| This movie shows the evolution of supergranular cells on the photosphere over 36 hours, derived from MDI continuum data. Cells are tracked over time by correlating the position of their central outflow region. The color of individual cells is random, but an identified cell keeps the same colour over time. The data loops forwards and backwards over the time range. The white horizontal line represents the equator of the sun, and the total field of view is 3.9 x 10.3 arcmin. |
 |
-
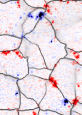
Overlay of magnetic elements with high resolution supergranular lanes
| The movie shows the evolution of the supergranular cells, over a 31 hour period, with the line-of-sight magnetic field obtained from MDI high resolution magnetograms overlaid. The red and blue indicate the polarity of the field, with zero field being white. Note the concentration of the magnetic field at the cell boundaries, and the convergence and disappearance of field at cell vertices. The field of view is 3.9 x 3.3 arcmin.
|  |
You are welcome to use these movies for talks or presentations, but please let me know by emailing me at hugh@astro.gla.ac.uk
[1] Potts, H.E., Khan, J.I., Diver, D.I Small-Scale Energy Release Driven by Supergranular Flows on the Quiet Sun Solar Physics 245 (1) 55-68 (2007) (preprint)
[2] Potts, H.E., Diver, D.I Automatic Recognition and Characterisation of Supergranular Cells from Photospheric Velocity Fields Solar Physics In press (2007)