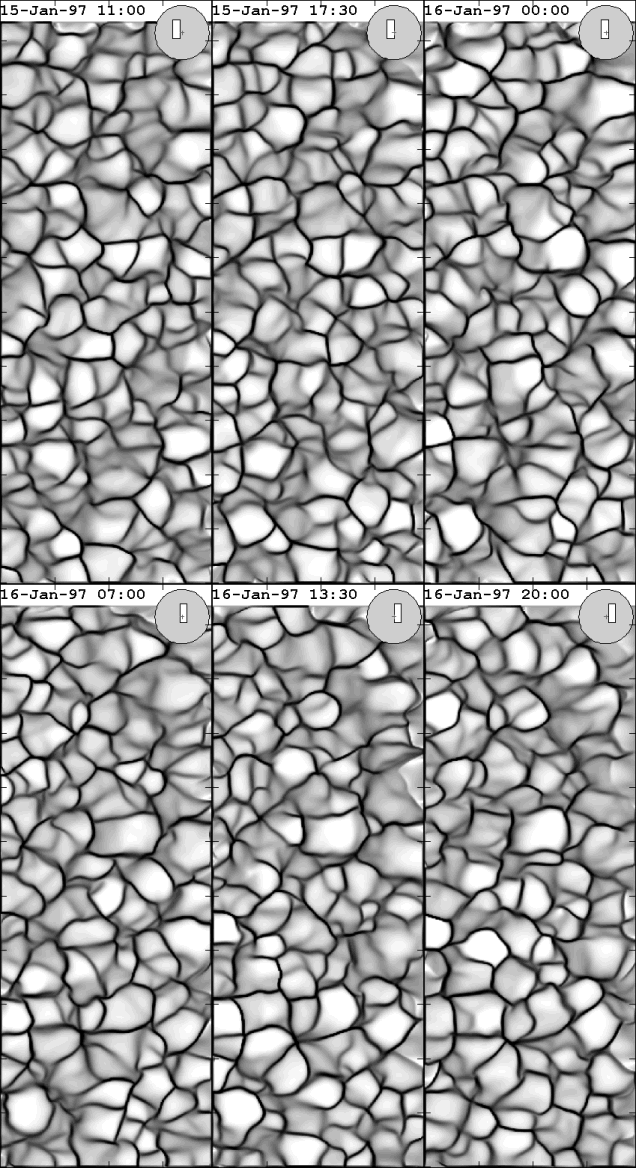
| This figure shows the evolution of supergranular cells over a 36 hour period. The flow patterns were tracked using Balltrack on a 384x1024 pixel (3.8x10.2 arcmin) segment of MDI data, which followed the mean rotation of the sun. The supergranular lanes were then found from the derived velocity field. The formation and splitting of many supergranules can be seen, and the differential rotation of the sun is clearly visible. |  |
| Supergranular lanes over a 36 hour period. The area of the data is 3.8x10.2 arcmin. The circle in the top right represents the solar disk, and shows the position of the data window. |
 |
Simulated granulation data | Home |