EUV (EIT) waves are wavelike disturbances of enhanced extreme ultraviolet (EUV) emission that propagate away from an eruptive region. Recent years have seen much debate over their nature, with three main interpretations: the fast-mode MHD wave, the apparent wave (reconfiguration of the magnetic field), and the hybrid wave (combination of the previous two). Observations of such waves are often accompanied by type II radio bursts, which are widely considered as signature of coronal shock waves. However, their link to EUV waves is uncertain and the association holds clearly only for the fastest EUV waves.
By studying the kinematics of EUV waves and their connection with type II radio bursts, we aim to examine the capability of the fast-mode interpretation to explain the observations, and to constrain the source locations of the type II radio burst emission.
Methodology
To investigate the association between EUV waves and type II radio bursts we follow the formalism of Wang (2000) in the modeling of EIT waves, but depart from it by using a global MHD model for the ambient corona. We model the propagation of EUV waves as a fast-mode MHD wave and identify the ray paths that are compatible with the drift rates deduced from the radio observations. Uchida (1968) showed, in the WKB approximation, (short-wavelength limit) that an MHD wave may be regarded as being propagated along rays that are refracted by the nonuniform medium.
In our model, the simulation of the propagating wave front takes as input the coronal data from the global MHD model, the coordinates of the origin point of the EUV wave and a distribution of initial wave vectors that determine the initial directions of propagation (initially uniformly distributed). The output of the simulation is a collection of ray paths representing the successive spatial positions in time of the different wave vectors. For a given time, we can therefore derive the EUV wave front.
To compare the simulated wave front with actual EUV observation, a visualization scene was created where EUV spectroheliograms were mapped onto a 3D representation of the Sun. With this method we can simultaneously view the computed wave front and the real observations.
The analysis of the frequency drift of type II bursts (plasma emission) gives us access to the variation in electron density along the path of the shock wave. Inversely, we can infer from the model, the electron density along each calculated ray path and convert it into a temporal evolution in frequency and deduce which instantaneous position along each ray path could be responsible for the observed radio emission at the same moment. For that we identify the boundaries of the type II in the radio spectrum fit third-degree polynomials to them, and then identify the ray-path points that are inside this frequency domain.
Analysis and results
In this study we analyzed 2 events that present two different geometrical configurations, one edge-on (SOL2017-04-03T14:20:00) and one face-on (SOL2017-09-12T07:25:00). The main analysis methods are the same for both events.
The coordinates of the origin point for the EUV wave was identified by combining EUV (PROBA2/SWAP, SDO/AIA) and RHESSI observations. To account for the uncertainty in height of the X-ray source, the RHESSI peak coordinates were deprojected, as if the source was located at different heights. This way a sample of “possible” origin points, derived from observations, was created. After testing, the origin point that provided the best match with the EUV observations was selected to continue the analysis.
In order to examine the behavior of the wave front, we created a number of visualizations scenes, which also produced synthetic movies for the duration of the events. An example for the first event is shown below in Fig. 1.
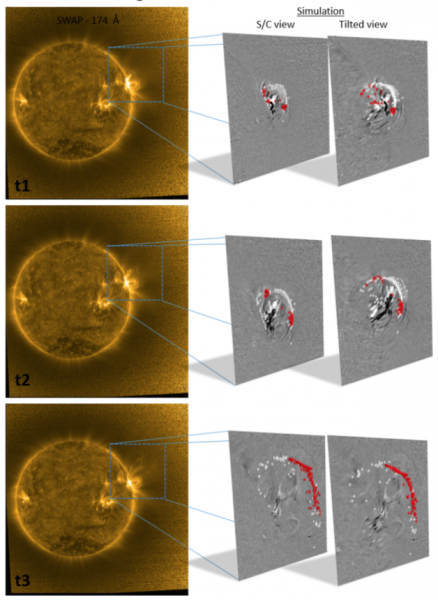
Figure 1 – Left: images of PROBA2/SWAP 174 Å for three different times during Event 1 (from top to bottom: 14:26:10 UT, 14:28:00 UT, 14:37:10 UT). Right insets: zoom into the region of interest. The simulated wave front is displayed with white and red points on top of a background of PROBA2/SWAP running-difference images. Two different viewing angles for the same moment are shown, one that represents the PROBA2 viewing position and one tilted viewing position that was selected to optimize the visibility of the simulated wave front. The red points are identified candidates for the type II radio burst emission.
Additionally, we calculated the angle between the wave vector (K) and the magnetic field (B) for every ray-path point. The results (right panel in Fig. 2) show that for almost all the ray-path points whose density matches that of the source of the radio burst (in red), the corresponding wave vectors are quasi-perpendicular to the magnetic field.
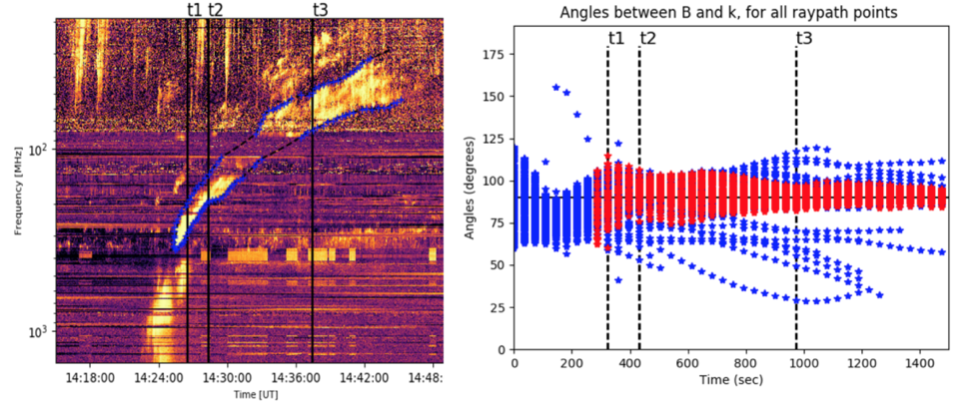 Figure 2 – Left: dynamic radio spectrum from the Humain station, showing the signature of the type II radio burst during Event 1. The three vertical lines correspond to the time of the snapshots in Fig. 1. Blue crosses represent manually selected points and the dashed black lines the fitting curves. Right: angles between the magnetic field and the wave vector for every ray-path point. Red indicates the ray-path points that are identified as the potential source of the type II radio burst emission based on the local electron density matching the plasma frequency.
Conclusions
Our main conclusions are that: 1) even a fairly simple ray-path model of fast-mode MHD waves displays a good qualitative match with the observations, 2) the location of the type II radio burst emission on the propagating wave front can be derived for the duration of the event, 3) the position of the type II radio burst source on the wave front is not stationary but evolves with time, meaning that different areas of the wave front can be responsible for different parts of the radio burst signature and 4) the wave vectors of the ray-path points that are identified as the potential source of the radio type II burst emission are quasi-perpendicular to the magnetic lines.
This study serves as an initial examination of a framework for the analysis of the association between EUV (EIT) waves and type II radio bursts, and is planned to be extended in the future, specifically: by refining the fast-mode model and by the comparison of the localized type II radio burst source with radio images, which will be the main validation test for the aforementioned results.
Additional info
Based on the recent paper: Alexandros Koukras, Christophe Marqué, Cooper Downs, Laurent Dolla (2020) “Analyzing the propagation of EUV waves and their connection with type II radio bursts by combining numerical simulations and multi-instrument observations”, 2020, A&A, 644, A90. DOI: https://doi.org/10.1051/0004-6361/202038699 .
The movies of this study are available in https://www.aanda.org and in http://solweb.oma.be/users/akoukras .
*Full list of authors: Alexandros Koukras, Christophe Marqué, Cooper Downs and Laurent Dolla
References
Uchida, Y. 1968, Sol. Phys., 4, 30
Wang, Y.-M. 2000, ApJ, 543, L89