The Sun is the main source of space weather, and one type of solar event that is critical to space weather is a coronal mass ejection. Coronal mass ejections (CMEs) are large eruptions of magnetized plasma from the Sun that produce energetic particles, which can cause geomagnetic storms on Earth. One method that has proven successful in determining the strength and structure of the coronal magnetic field is Faraday rotation (FR), which is the rotation of the plane of polarization when linearly polarized radiation propagates through a magnetized plasma. Previous observations of CME Faraday rotation have all been limited to a single line of sight (LOS, such as Howard et al., 2016, and Kooi et al., 2017), whereas we report the first successful observations of Faraday rotation through a CME using multiple lines of sight: 13 LOS across seven target radio fields. These observations were made using the “triggered” observation mode of the Karl G. Jansky Very Large Array (VLA) of the National Radio Astronomy Observatory (NRAO). Triggered observations ensured that there would be multiple sources present to probe different regions of the solar wind and CME when a CME suddenly appeared.
Modeling the Coronal and CME Faraday Rotation
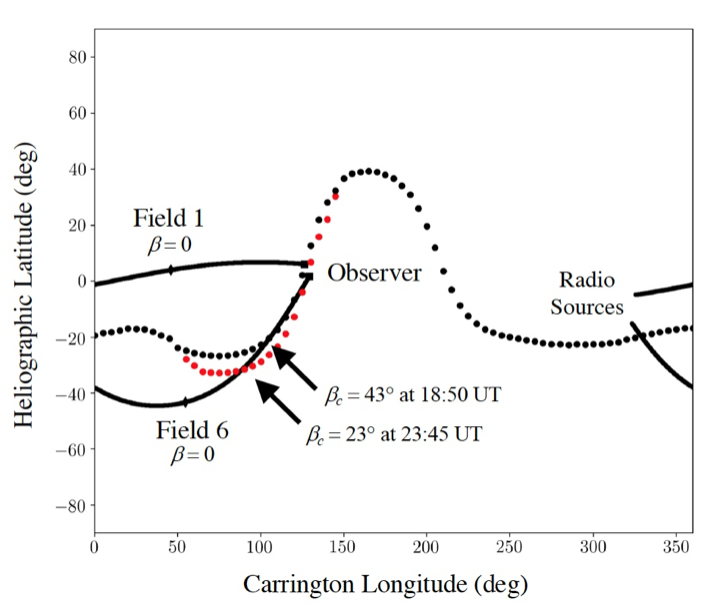
The 2015 observations were made during solar maximum and, therefore, the Sun was extremely active. Multiple CMEs were present leading up to our observations. Two particularly large CMEs that initially erupted on 30 July 2015 and early 31 July 2015 caused noticeable restructuring of the corona off the eastern limb of the Sun in both LASCO-C2 and C3 images. Included in this restructuring was a southward shift in heliographic latitude of the southeastern streamer belt. The southward shift did not affect the impact parameter for a given LOS but did alter the angle [βc] at which the LOS crosses the heliospheric current sheet (HCS), especially for LOS with heliographic latitudes proximate to the HCS. Fig. 1 shows the model HCS shift applied to the synoptic chart neutral line data.
Thomson-scattering brightness (TSB) is the observed radiation from the photosphere that has been Thomson-scattered by electrons in the coronal plasma. TSB can be directly measured using coronagraph images from LASCO-C2/C3. TSB is a LOS integral that can be inverted to solve for the plasma density and, therefore, determine its contribution to the observed Faraday-rotation measurement. In order to calculate the plasma density of the corona, before occultation by the CME, we performed a χ2-minimization process to determine which of four models accurately described the TSB profile; single-term power law, coronal streamer model, coronal hole model, and LDB model. The single-term power law model consists of a single-term power law and provides good predictions of Faraday rotation measurements at heliocentric distances ranging from 6-20 solar radii. The streamer and hole models use two-term power laws for dense coronal streamers and tenuous holes, taken from Mancuso & Spangler (2000). The LDB model employs a three-term power law and is typically used for the quiescent corona, much like the single-term model. The LDB model was determined by Leblanc, Dulk, and Bougeret (1998) by measuring the onset time of Type III radio bursts measured by the WAVES instrument onboard the WIND spacecraft.
To model the magnetic structure of the CME, we assumed a force-free flux rope configuration for the magnetic field. We explored three models for the plasma density structure: constant density, thin-shell, and thick-shell. The reason we explored three plasma density models was because a strong shock front was present, as evidenced by the presence of a Type II radio burst associated with the CME. The fundamental harmonic was detected at ~15:50 UT, lasting until 22:30 UT, and was followed by a second harmonic Type II radio burst that began at ~17:00 UT on 31 July, lasting until ~6:00 UT on 1 August. We could not determine the exact morphology of the CME in white light images; consequently, we assumed simple geometric configurations for the CME’s orientation with respect each LOS.

Figure 1 – Synoptic chart used to calculate βc for coronal conditions in 2015 (Carrington rotation 2166) and demonstrate the effect of the HCS shift on Fields 1 and 6. The solid lines are LOS to Field 1 (northern latitudes) and Field 6 (southern latitudes) projected onto the Sun’s surface in Heliographic Latitude and Longitude at 23:45 UT. The black dotted line gives the location of the neutral line near the beginning of the observations (18:20 UT) and the red dotted line gives the full 8$^\circ$ shift of the neutral line near the end of the observations (23:45 UT). The solid diamonds give the midpoint of the LOS (β = 0) and βc is measured where the LOS and neutral line intersect. This appears as Fig. 5 in Kooi et al. (2021).
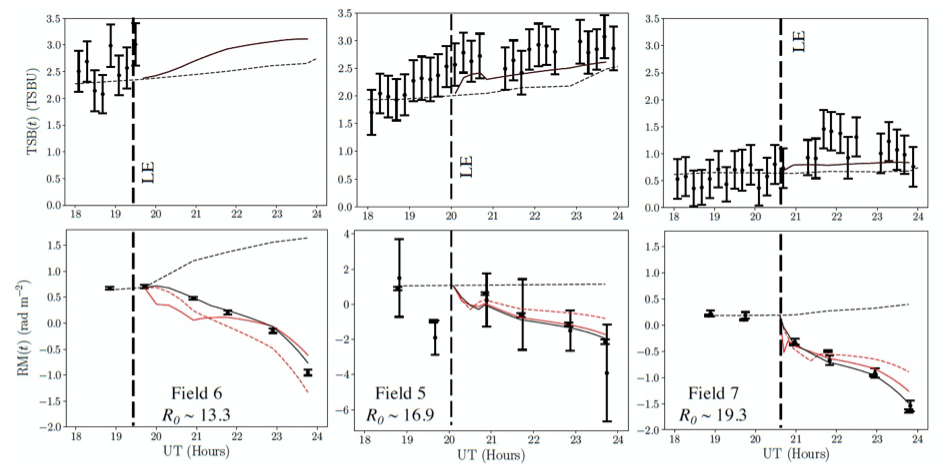
In order to compare our observational results from white-light coronagraph images and radio Faraday-rotation measurements to the coronal and CME models, we plotted the TSB (t) and RM(t) of each source as well as the models. Fig. 2 presents the data as well as the modeling results for Fields 5, 6, and 7, in which each were occulted by one leg of the CME and the shifting HCS (Fields 1 – 4 are also reported in Kooi et al., 2021). Our shifting HCS model only includes effects of the shifting neutral line (Fig. 1) and therefore the shifting HCS has a negligible effect on our coronal models for the TSB(t). TSB(t) data for Field 6 is unusable because it was corrupted by imaging artifacts shortly after occultation by the CME. However, the small increase in TSB magnitude is consistent with the model CME TSB(t).

Figure 2 – Above are TSB(t) (top panels) and RM(t) (bottom panels) for Fields 6 (left panels), 5 (middle panels), and 7 (right panels) on 31 July 2015. TSB(t) is given for one LOS to the Field center. RM(t) is given for LOS 1 of Field 6 and LOS 1 & 2 of Fields 5 and 7. The models for coronal contribution only (dashed black curve), the coronal and constant density CME model (solid black curve), the coronal and thick shell CME model (dashed red curve), and the coronal and thin shell CME model (solid red curve) are plotted as well. The vertical lines (LE) give the times at which occultation by the CME begins, assuming a linear speed of ~750 km s-1 for the CME. TSB is given in units of TSBU (1 TSBU = 10-12 solar brightness). This appears as Fig. 10 in Kooi et al. (2021).
Our shifting HCS model has the strongest impact on the source closest to the Sun (Field 6). By the end of the observations, the HCS shifted ~8$^\circ$, which increased the expected coronal contribution by a factor of two. Without including the HCS shift, the CME and coronal FR models would not be consistent with the data, especially for Field 6. The second data point at ~19:40 UT for Field 5 is not consistent with the coronal FR model: either the CME arrived earlier than expected at this field or this is a plasma sheath, as we likely saw in Kooi et al. (2017) and discussed in Wood et al. (2020). The constant density CME model is the most consistent with the data. Between the two shell models, the thin shell is much more consistent with the data reported here as well as the other radio fields discussed in Kooi et al. (2021).
Conclusions
The observations presented in Kooi et al. (2021) represent the first observations of CME Faraday rotation along multiple lines of sight and the first triggered VLA observations of CME Faraday rotation. The advantage of multiple LOS is that we can definitively determine the CME strength and helicity, therefore removing ambiguity surrounding the absolute sign of the CME’s axial magnetic field.
The only model that successfully reproduces the RM(t) results for all sources is the one in which: the northern leg (in heliographic latitude) is angled away from the Earth (βcme < 0) and the southern leg is angled toward the Earth (βcme > 0); the axial magnetic field is directed out from the Sun into the northern leg and directed into the Sun from the southern leg; the helicity is +1 (right handed). TSB(t) and RM(t) data both strongly favor the constant density and thin shell models over the thick shell model, as the thick shell model is not consistent with the observed RM(t) for Fields 1, 2, 6 and 7. We were therefore able to determine that at the Sun, Ncme ≈ 476 x 103 cm-3 and Bcme ≈ 2,575 mG and at Earth, Ncme ≈ 0.01 x 103 cm-3 and Bcme ≈ 0.05 mG assuming frozen-in flux. The use of multiple LOS also proved a strong test for our model of the shifting HCS. Data for the LOS presented in Fig. 2 show strong evidence that this shift occurs at Carrington longitudes between 50$^\circ$– 140$^\circ$. Because the LOS provided by Fields 5-7 each sample different regions of the corona, there is limited ambiguity of the nature of the shifting HCS.
Radio remote-sensing ground-based measurements of Faraday rotation have the potential for great synergy with in situ measurements of space-based platforms such as the Parker Solar Probe (PSP) and Solar Orbiter (SO). PSP and SO can measure the micro-scale physics of the corona whereas Faraday rotation measurements can provide information about the macro-scale physics.
*Based on the accepted paper: Jason E. Kooi, J. E., Madison L. Ascione, Lianis V. Reyes-Rosa, Sophia K. Rier, and Mohammad Ashas: “VLA Measurements of Faraday Rotation through a Coronal Mass Ejection Using Multiple Lines of Sight,” 2020, Solar Phys., 296, 11 (2021). https://doi.org/10.1007/s11207-020-01755-4
References
Howard, T.A., Stovall, K., Dowell, J., Taylor, G.B., White, S.M.: 2016, Measuring the Magnetic Field of Coronal Mass Ejections Near the Sun Using Pulsars. Astrophys. J., 831, 208.
Kooi, J.E., Fischer, P.D., Buffo, J.J., Spangler, S.R.: 2017, VLA Measurements of Faraday Rotation through Coronal Mass Ejections. Solar Phys., 292, 56.
Leblanc, Y., Dulk, G.A., Bougeret, J.-L.: 1998, Tracing the Electron Density from the Corona to 1au. Solar Phys. 183, 165.
Mancuso, S. Spangler, S.R.: 2000, Faraday Rotation and Models for the Plasma Structure of the Solar Corona. Astrophys. J. 539, 480.
Wood, B.E., Tun-Beltran, S., Kooi, J.E., Polisensky, E.J., Nieves-Chinchilla, T.: 2020, Inferences About the Magnetic Field Structure of a CME with Both In Situ and Faraday Rotation Constraints. Astrophys. J. 896, 99.
